To make up for falling organic reach on Facebook, major brands are shifting their allegiance to the photo-sharing app, report by L2 and Olapic finds.

Brands are now posting more content to Instagram than they are on Facebook, according to a new report by research firm L2.
It’s not quite an unfriending situation. More like brands have found a new best friend.
You can probably guess the reason. Giving plunging organic reach on Facebook, marketers have been cutting back on posting on Facebook and paying for reach with advertising dollars, the report says. On the other hand, Instagram is mostly a free-for-all. The Facebook-owned photo-sharing network has some advertising options but most brand activity is organic, and user feeds, although growing more competitive, are still unfettered by algorithm, meaning that, at least in theory, consumers who follow a brand will see all of that brand’s posts.
The L2 report found that the 250 brands it tracked posted an average of 9.3 times per week on Instagram and 8.8 times on Facebook in the fourth quarter of 2014. The Facebook activity was down from 11.1 a week at the same time in 2013. Meanwhile, posting on Instagram increased nearly two posts a week (from 7.5) and is up 23% over the last five quarters.

Other notable findings from the report, which L2 prepared in partnership with social marketing tech firm Olapic:
- The auto industry, led by luxury brands like BMX, Mercedes-Benz, Audi and Porsche, outperformed all categories (Beauty, Consumers Electronics, Travel, Watches & Jewelry, Fashion, Sportswear, Retail, Drinks) with a 1.52% per post engagement rate on Instagram. Drinks — Stella Artois, Jack Daniels, Belvedere, Pabst Blue Ribbon — was second at 1.32%.
- Of the top 200 highest performing posts, 65% prominently featured a product, 43% included general lifestyle photography and 29% included a brand ambassador or other influencer.
- Hyperlapse has lapsed with only 75 — or only 2.4% of brand videos posted since August — brand posts using the time-lapse video app. Brand Hyperlapse activity has fallen off steeply since September and the engagement rate on the videos is 0.69 percent, slightly less than conventional Instagram videos.
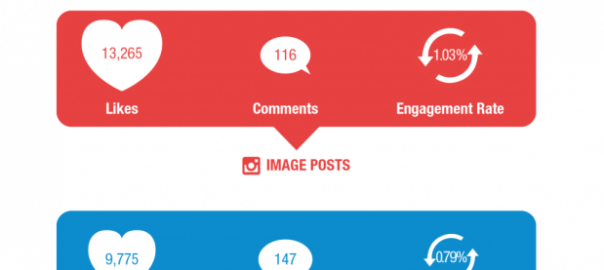
- Photo posts drive higher engagement that video, 1.03% to 0.79%. Videos attract more comments, but photos draw significantly more likes.

About The Author

Martin Beck is Third Door Media’s Social Media Reporter, covering the latest news for Marketing Land and Search Engine Land. He spent 24 years with the Los Angeles Times, serving as social media and reader engagement editor from 2010-2014. A graduate of UC Irvine and the University of Missouri journalism school, Beck started started his career at the Times as a sportswriter and copy editor. Follow Martin on Twitter (@MartinBeck), Facebook and/or Google+.
(Some images used under license from Shutterstock.com.)
Marketing Land – Internet Marketing News, Strategies & Tips
(313)