If you’re running Twitter Ads and wondering why your cost per action is high, this post will show you how to use Twitter’s campaign reporting and analytics to deep dive, optimize, and refine your campaigns.
In order to take advantage of these actionable insights, you must have Twitter’s conversion pixel installed. If you don’t, log into Twitter Ads and navigate over to Tools > Conversion tracking to get set up.
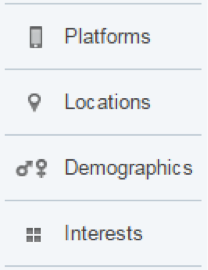
Let’s take a look at a few of the reports available that can be used to improve your campaign’s performance. To begin, click into a campaign you’re interested in optimizing and navigate to the left side where you’ll see this:

Optimizing Tweets
Like any other advertising channel, you’ll want to test out different variations of copy to see which one drives the most conversions. You can see the results of how each tweet performs in the Tweets tab. The test below shows three different tweets, one standard promoted tweet and two website cards.
For this campaign, you can clearly see that website cards are more effective than a standard promoted tweet in driving whitepaper downloads. From a simple calculation, we can see that the conversion from site visit to download is 22% for website card versus 17.5% for standard promoted tweet. Even looking at the first two tweets, which are identical in copy, the website card performs better.
There is a belief that website cards perform better because it’s more visually appealing and takes up more real estate in the timeline, but that’s not always the case for all our campaigns. Each audience is different and should be treated as such.
Recommendation: Pause the lower performing ad so spend gets allocated to the better performing ads. Test a variety of different ads and see what the audience resonates with best.

Optimizing Platforms
Keeping in mind that 80% of Twitter’s active users are on mobile, it’s crucial to understand how your mobile landing page experience is on multiple devices. If you take a look at the campaign below, desktop and laptop users are much likely to convert in comparison to mobile.
Recommendation: Build campaigns to target only one device each. By doing so, you will be able to clearly see and optimize the experience for each device closely and use your budgets more wisely.

Optimizing Locations
When you add in all of your locations into one bucket, you lose control of how that spend gets allocated and you are unable to control or tailor ads specific to that location. Take a look at the distribution below and you’ll see that New Zealand barely gets any love. Even when increasing budgets, United States and Canada will eat that spend up because it’s likely that there are more users in those locations that are engaging quicker than those in other regions.
Recommendation: Build campaigns to target only one country each to have better control of budget allocation and to scale more in the desired geography.

Optimizing Handles
If you’re running campaigns where you’re targeting specific Twitter handles, this report is extremely crucial to your campaign success. The Handles tab will allow you to see how much spend is allocated towards different handles and how each of those handle segments performs. It is likely that more spend will shift towards popular handles with a lot of followers, assuming they are engaging with your tweet.
Recommendation: This report should be pulled often and monitored closely to reduce spend on irrelevant handle targeting. Keep targeting the handles that are performing successfully and remove handles that are generating too much spend with low conversions.
If you are finding a number of handles eating up too much of your spend, there are two course of action: [1] if they are performing successfully in the existing campaign, keep them in the existing campaign, remove the lower spending handles and move them into a new campaign or [2] if they are not performing successfully but you want to try to continue optimizing, remove the popular handles and move them into a new campaign. The rule of thumb is when something performs well, don’t touch it.

By using all of these different reports, you’ll be able to quickly understand how your spend is allocated and see what tweets, platforms, locations and handles are driving to your desired goals.
(256)