
“You can’t manage what you can’t measure,” management theorist Peter Drucker is often quoted as saying. This holds especially true for social media, where correct measurement is a non-trivial task.
Most professionals use tools such as Mention, SproutSocial or Hootsuite to monitor and analyze social media performance. There is, however, one significant problem: None of these tools, free or paid, gives you complete data, leaving many valuable insights hidden. On the bright side, you can get all the missing data at no cost by using the analytics tools that are built into the main social media networks.
What’s on the Market?
The market is saturated with companies who offer social analytics and monitoring solutions, either on their own or as a part of a larger suite. Some of the more familiar and accessible of these platforms are Hootsuite, SproutSocial, Mention, Audiense (formerly SocialBro) and SumAll. In the mid price range there are the likes of Simply Measured, Klear, Brandwatch and TalkWalker. And then there are the enterprise solutions from heavyweights such as IBM, Salesforce, Oracle, Adobe and SAS. For more information on these solutions, check this comparison.
These companies offer various aspects of data and levels of analysis. The main difference in price results from the ability of a tool to show complex metrics in an accessible way and use algorithms that offer predictive analytics. However, social media networks’ APIs make the exact same data available to all social analytics tools, expensive and cheap alike.
This means that when it comes to measuring your daily performance, these solutions have the same initial data to work with, regardless of the eventual presentation of these data. For example, the only engagement metrics that Twitter’s API provides are Likes and Retweet counts. If you are using a solution such as HubSpot which offers URL shorteners, then you can also get data about link clicks.
This is why most tools can’t provide a 360-view of your social reach and engagement. For daily tasks, it’s usually enough to know a basic trend but whenever you want to adjust core aspects of your social strategy, more care and data are required. Luckily, getting the additional data is very simple and absolutely free: it already comes packed with your social profiles. I’m talking, of course, about the analytics tools that are built into the various social media networks.
For a long time, social networks didn’t provide much data to their users but as they started to monetize their huge audiences, a need to to provide analytics to marketers rose quickly and most social networks were quick to implement some built-in solution. Some of these solutions have by now grown to be powerful tools.
What Important Data is Missing?
I like to divide social data into two kinds: descriptive and actionable (inferential). Descriptive data shows an existing status or a trend, but doesn’t tell you what causes the trend. For example, a metric such as a number of new fans or followers will tell you whether more or less people decided to follow you but it won’t tell you why they did so or which actions you should take to improve this metric. On the other hand, actionable data helps you to see beyond just a trend on a chart. It allows you to spot actual insights that can answer complex questions and be used to alter your social strategy.
Most social analytics tools lack actionable data because of the scarcity of metrics provided by the social networks’ APIs. The built-in analytics solutions provide more accurate and more complete data about your social media performance. Built-in analytics provide many engagement types beyond the well known Like, Reshare and Comment as well as context to those engagements. This is like looking through a microscope – a whole new world exists on this level of detail.
For example, with actionable data you can easily determine whether your content is truly engaging your audience by analyzing engagements in the context of impressions – did you need just a 100 impressions to generate 10 engagements or was it closer to 10,000 impressions? Without this context, engagements tell very little about the true interest of your audience in the content you are sharing. In another example, you could determine what type of media resonates with your audience by placing engagement in context with media types.
That being said, descriptive data is more useful on a day to day basis when you just need to know the current status and to be able to quickly spot emerging problems. The need in actionable data kicks in when you decide to change something.
Where to Find the Right Data?
Through the rest of the article, I will only discuss actionable data that you can find on Twitter, Facebook and LinkedIn. More specifically, I tried to present a unified workflow that balances simplicity of analysis, impact and speed for the time-starved marketer. You can of course carry out more complex analysis to predict future trends, but I believe that the time to value ratio will diminish.
Which Data to Look for on Twitter Analytics?
You can access Twitter Analytics by visiting analytics.twitter.com and logging in with your Twitter account. After logging in, you will land on the “Home” tab where you have a quick overview of your main descriptive metrics. Skipping to the “Tweets” tab, you can see data about impressions, likes, retweets, replies and link clicks by day as well as data about individual posts.
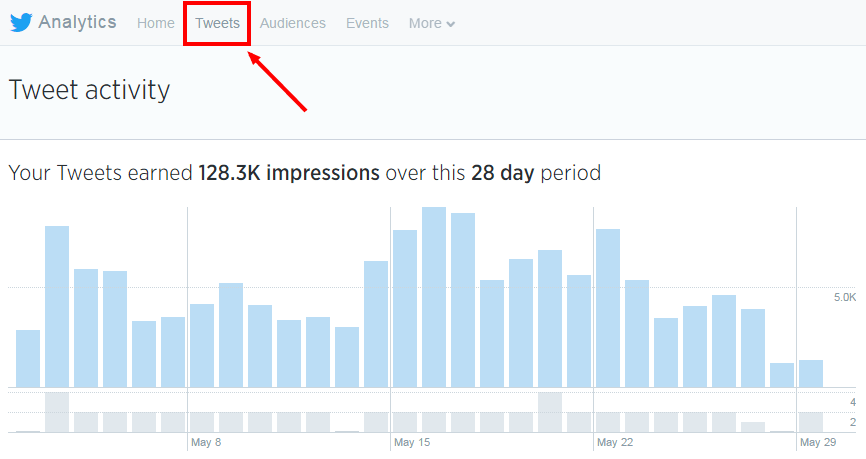
Next to each individual post, you have the number of impressions, engagements and an engagement rate (engagements divided by impressions). Clicking on a specific post will show you a breakdown of the engagement types such as likes, replies etc. This data is interesting because it gives you the details and context.
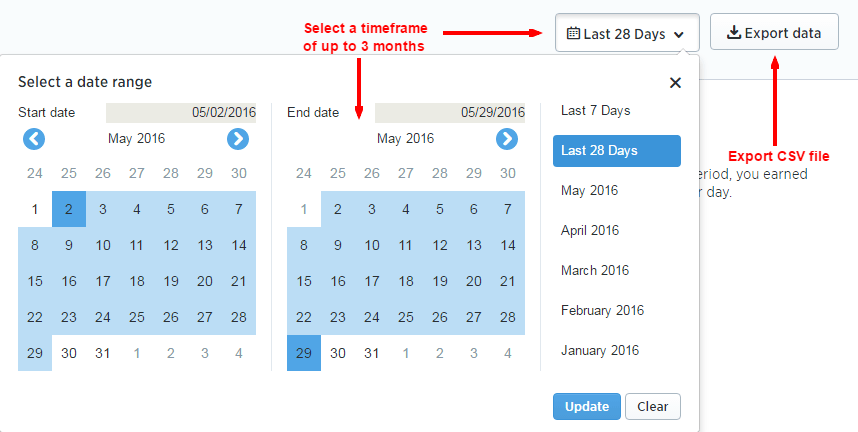
Unfortunately, Twitter doesn’t allow you to sort these posts, which makes it hard to uncover insights. On the bright side, Twitter allows you to export data which you can conveniently analyze in your tool of choice (e.g. Excel, Google Spreadsheets or various data analysis tools such as Pandas). To export data from Twitter, choose a time frame and click on the button labeled “Export data”.
In the exported data, each engagement type gets a column, which makes it easy to isolate engagements, timestamps, impressions and other data. You can easily aggregate data or analyze individual posts. This flexibility allows you to quickly discover valuable insights about the content types to share, when to share them, how to annotate and so on.
Useful Insights to Look for on Twitter
- Impressions and engagements per hashtag – find your best performing hashtags by retrieving the hashtags from the post texts and using them to group engagements
- Impressions and engagement by time – convert the timestamps from UTC (Twitter default) to your local time zone and find out when people interact with your content
- Impressions and engagement by day of the week – convert the dates to week days and check if there are some days when you should be posting more
- Impressions and engagement by post length – sort posts by number of characters or words to find out the optimal length for your annotations
- Impressions and engagement by media type – isolate tweets with image URLs from those without and combine with the media column to sort engagements by media type
- Organic vs paid engagment – compare organic engagement against paid to determine how much to invest and where the balance lies
- Best performing posts – sort posts by engagement rate to find the ones with the most engagements per impression. These posts engage a large portion of the people they reach and are therefore a solid guideline for deciding which content to share more of.
The great thing about exporting this data is that you have the flexibility to mix metrics to discover really interesting insights. For example, maybe some times are better for posting specific media types than other times. Maybe posts with more than 100 characters should have 3 hashtags and those with less only 2 hashtags. Or perhaps posting towards the beginning of each hour is more likely to reach your audience.
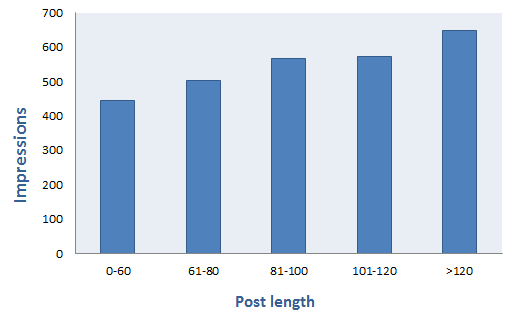
The chart below is an example of a visualization of how on average tweet length influences impressions. The chart is based on our own posts at inboundli and uncovers an interesting insight – while many marketers argue that Twitter annotations should be kept short, we consistently found that longer tweets work better for B2B companies (data from 12 million B2B posts). This doesn’t necessarily contradict the commonly accepted truth because the longer tweets had hashtags, mentions and images. These make posts longer without touching the annotations while increasing reach and engagement.
Twitter has a well-balanced analytics platform with plenty of insightful and interesting data that are a great addition to whichever analytics solution you are using.
What Data to Look for on LinkedIn Page Analytics
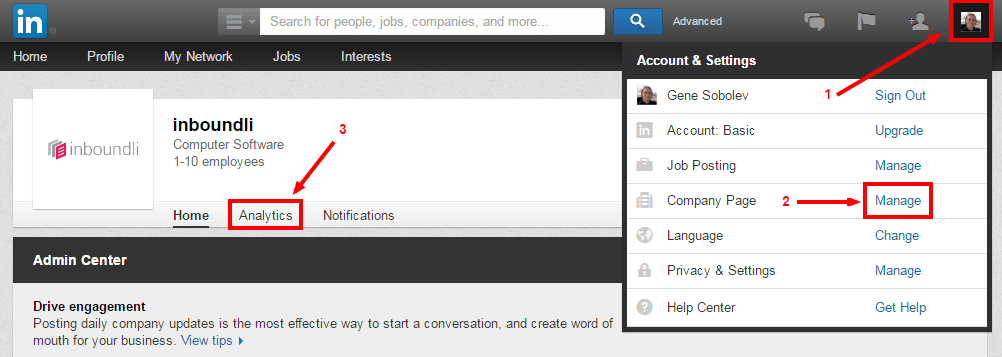
Access LinkedIn Page Analytics by first clicking on your LinkedIn photo at the top-right corner of the navigation bar. From the dropdown menu that appears, locate the section titled “Company Page” and click on “Manage”. On the company page, click on the tab labeled “Analytics” under your company’s logo.
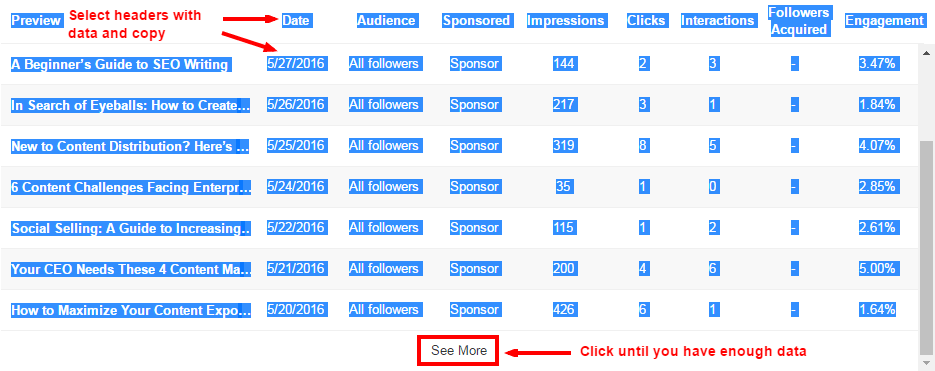
The data that LinkedIn provides is scarce, but it’s nevertheless useful. The actionable metrics on LinkedIn are found at the very top in a section called “Updates”. Here you can see individual posts with data about impressions, clicks (clicks on content, company name or logo), interactions (likes, comments and shares), new followers on sponsored updates and engagement ratio.
LinkedIn currently doesn’t provide a way to export this data. One way around this is to download an extension such as Export Linkedin Analytics. However, the data exported with the extension is not organized in an optimal way. Another way is to manually select and copy the data and column headers in the Updates section (you will need to click on “See more” several times until you see all the data you want to select). When you paste the data in a program like Excel, the copied values will be placed in columns and cells with the headers correctly corresponding. Although it’s a manual process, it hardly ever takes more than 5 minutes to get all your data ordered in a spreadsheet.
Useful Insights Unique to LinkedIn
- Follows from sponsored updates – it’s hard to get followers on LinkedIn, which is why it might make sense to sponsor content that can drive followers for your company page
Of all the main social networks, LinkedIn offers the least data via its API. The additional data from the built-in analytics is a welcome addition to the analytics solution that you are using to monitor LinkedIn.
What Data to Look for on Facebook Insights
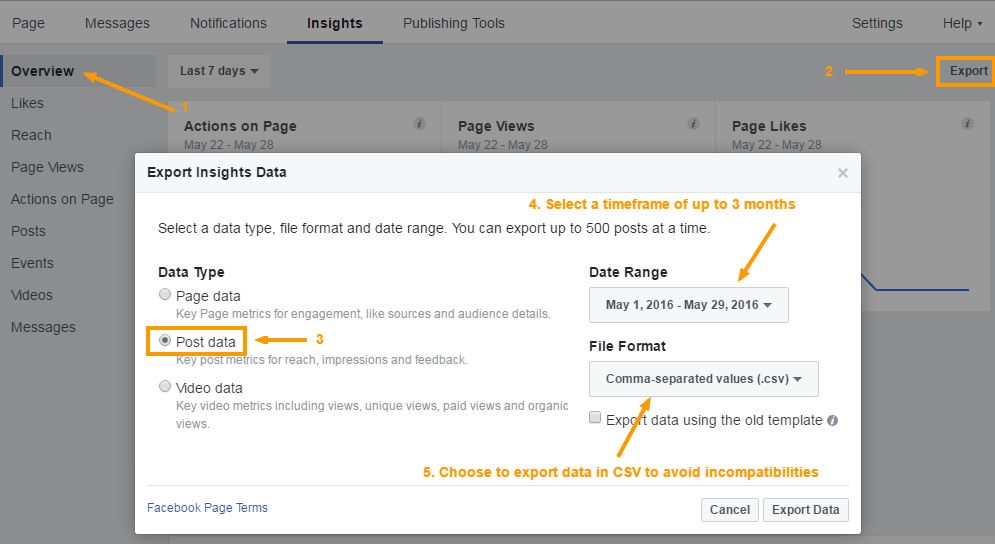
To access Facebook Insights click on the down arrow at the top-right corner of your account and select “Manage Pages” from the dropdown menu that appears. From a list of your pages, select the Facebook Page you would like to manage and select the “Insights” tab once on the Page.
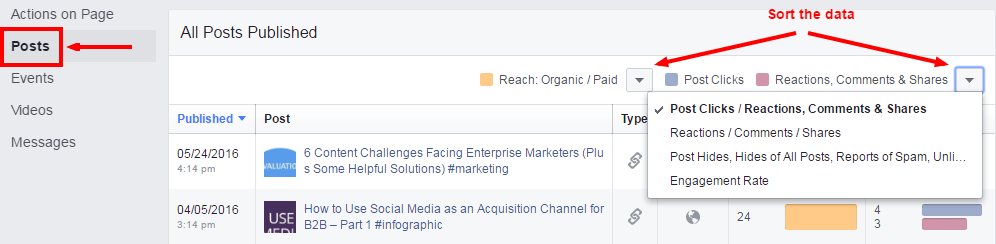
The menu with the most actionable data is titled “Posts” and has a section called “All posts published”. This section has data about each post in your Facebook feed. The data includes a timestamp, the post text, type (link, image etc.), geographic targeting, reach and engagements (clicks, likes, reactions, comments and shares). The great thing about this section is that Facebook allows you to sort the data by various properties, making the analytics interface more flexible than the ones offered by Twitter and LinkedIn.
Exporting data from Facebook Insights will give you even more flexibility and easier access to insights. Click on the button labeled “Export” from the top-right corner of the “Overview” menu. Select to export “Post Data”, a time range, a file format and you are ready. The exported report offers the same flexibility as Twitter’s export.
Useful insights unique to Facebook
- Impressions and engagement by time* – convert the timestamps from Pacific Time to your local time zone.
- Engagement by content type** – sort engagements by media type.
- Impressions vs. reach*** – determine how many unique people your post reached and how many times a unique person was served your post.
- Engagement from people who like your Page – check whether your page has the right following and whether your content is reaching them
- Negative feedback – check if your posts are steering any negative emotions
- Engagement by video length – find the optimal length of videos to post
* Unlike Twitter, the default time in Facebook is Pacific rather than UTC.
** Unlike Twitter, Facebook provides a dedicated column for media types so you don’t have to compile data from various columns.
*** You can read this post if you would like to know more about the distinction that Facebook makes between reach and impressions.
Similar to Twitter, you can mix metrics to get a better sense of what to improve. Facebook has a lot of useful metrics and makes it very easy to optimize posts for your specific audience.
Benchmarking Social Networks
Many of the metrics are compatible across social networks. I recommend using these metrics to do an in-depth comparison of your performance on Twitter, Facebook and LinkedIn.
Engagement rate, media types and days of the week are among the many compatible metrics. One important feature is that the exported data allows you to differentiate between organic and paid engagement, which gives you an important segmentation ability. For example, you might find out that Twitter has much more impressions than Facebook, but if you compare organic and paid engagement, you might discover that promoted posts on Facebook are more engaging – an insight you could have otherwise overlooked and decided to scale down your Facebook activity.
You might find out that each platform has different optimal times and days for engagement, which can lead you to optimize your content calendar. You might find out that different post lengths perform differently on the social networks and optimize annotations for each network.
How to Make it Manageable
As a fellow marketer, I know how time-stranded you are and it might seem overwhelming to do the analysis I described routinely. Luckily, the analytics solution you are using is most likely enough for periodical measurement needs and is probably more convenient for that task as it hopefully aggregates data from all the networks in one place.
The analysis I suggested is required when you need to see beyond a trend or current status. I recommend doing the analysis I described every half a year (which should provide you with enough fresh data to notice changes). This will help you to discover the reasons behind emerging trends in your weekly reporting and allow you to tweak or pivot your strategy. Other occasions when you might want to go deeper with your social metrics are when you spot a bad trend in your weekly reporting or if you are planning a strategy shift.
Conclusion
There are plenty of good social analytics tools on the market, but the free and built-in analytics tools of various Social Media offer great additional data which is reliable (coming from the source) and easily accessible. By exporting data from these analytics applications, you can build the most flexible and comprehensive workflow to discover insights beyond the usual reporting metrics that can state the status quo but have little other use. Not using the built-in solutions means passing on the vast majority of insights related to your social media strategy. With a routine check and clearly defined metrics and goals, the possibilities are nearly unlimited.
Digital & Social Articles on Business 2 Community
(91)