So you want to expand your brand to YouTube. Congratulations! It’s a smart decision for myriad reasons. A strong YouTube presence can:
- Boost the discoverability of your brand: YouTube is the second-largest search engine, with more searches than Bing, Yahoo!, and AOL combined. In fact, 17% of all Internet traffic flows through YouTube.
- Build brand awareness with core demographics: Did you know that YouTube reaches more 18-34 and 18-49 year-olds than any cable network in the U.S.?
- Benefit B2B and B2C brands alike: Video is the most-used content type by B2B marketers (92%), outranking surveys (88%), white papers (88%) and case studies (87%). And more B2C marketers create video content than blogs (74% versus 67%).
To demonstrate just how in-demand YouTube still is, here’s another inspirational fact: videos are breaking into YouTube’s exclusive “Billion View Club” increasingly quickly.
As of June 2015, only two videos had joined YouTube’s Billion View Club. But since then, 8 new videos have surpassed a billion views, and they have done so in record time. The 3 most recent billion-view videos crossed the mark at an average of 241 days, half the time of the historical average (484 days).

Image via http://youtube-trends.blogspot.com/
But unless you’re in the music video business, 8 billion views is probably not a realistic goal for your brand. So how should you track your YouTube performance? Here are some tips for using the YouTube analytics platform to improve your video marketing.
1. Audience Retention Metrics: How To Find Your Optimal Video Length
Are visitors to your YouTube channel clicking and leaving after only a few minutes? Or are they watching videos through to completion? The Audience Retention tab within the native YouTube analytics platform will help you find out.
In a snapshot, you can see the total minutes watched, average minutes watched per view, and average percentage viewed for each of your YouTube videos. Of these metrics, average percentage viewed is especially helpful to optimize your video content.
In a nutshell, the average percentage viewed metric tells you when your audience stops watching. If your audience repeatedly quits watching after 90 seconds, for example, then you probably don’t want to invest resources in long-form video content.
On the TrackMaven YouTube channel, for example, the Clash of the Content Marketing Titans video has the highest total view time, our Moneyball Marketing video has the highest average view duration, and our What is TrackMaven? video has the highest average view percentage. The first two are longer videos of panel discussions with industry experts, while the latter is a short product explainer video. Predictably, viewership drops off ¼ of the way through the longer videos, while viewers watch ¾ of the short, snappy product video on average.

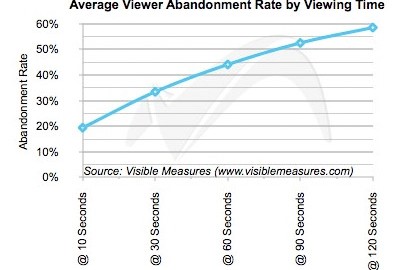
Viewer abandonment of video content is, of course, a function of time; across a long enough time frame, viewer abandonment will inevitably reach 100%. So what’s a realistic benchmark to aim for? Visible Measures analyzed 40 million video clips and found that you can expect to lose a third of your viewers within 30 seconds. Nearly half of your viewers bolt by the 60 second mark.

So what can you do to keep your viewers interested? Short informational videos can help inform your audience about your product or industry, and likely come with a lower production investment. Alternatively, longer videos can be broken up into a series of bite-sized videos. Either way, make sure to include the most important information — and your CTA, which we’ll cover next! — before your average viewer abandonment point.
2. Don’t Forget To Include A CTA!
Video content won’t bring leads in on its own; you have to be smart about lead capture through calls-to-action and follow-up campaigns. Smart CTAs allow you to capitalize on your YouTube traffic, and YouTube analytics help you optimize these goal completions as well.
Use the audience drop-off point you identified in #1 to inform where you include your CTA. If no one watches your videos to completion, then certainly don’t wait until the end to include your ask!
You can also identify your top traffic videos using the Views tab in YouTube analytics. Each of your top-performing videos should include an appropriate CTA within the YouTube video description.
Adidas, for example, didn’t miss the opportunity to capitalize on the 2 million+ views of their video featuring Leo Messi. They included a link to purchase the cleats worn by the soccer superstar directly in the video description.

3. Two Metrics Are Better Than One: The Power of Ratios
Let’s say your number of channel subscribers is growing. You might be content to pat yourself on the back. But beware the temptation of vanity metrics. While your YouTube audience might be growing, how well are you engaging new viewers?
Benchmarking your brand’s YouTube performance using a ratio of metrics — like video views per subscribers — will give you a clearer line of sight into the impact of your YouTube content as your audience grows.
To take these metrics one step further, try measuring averaging views per video per 1,000 subscribers. This ratio serves as a historical benchmark for your brand’s YouTube engagement as your posting frequency and audience changes over time. [Hint: The TrackMaven platform automates your brand benchmarking.]
Conclusions
Ready to to take a data-driven approach to YouTube? Here is our 3-step checklist:
- Determine when people typically drop-off from each of your different videos. Then ask yourself why and optimize the length accordingly.
- Add CTAs before people stop watching, or add them directly in your channel description/text.
- Use multiple metrics to benchmark how effectively you continue to engage a growing audience.
For even more tips, read these 6 best practices for optimizing your YouTube channel.
Digital & Social Articles on Business 2 Community(157)