— September 19, 2018
Metrics aren’t usually the the first thing that come to mind when you think about design, and performance data is more commonly associated with marketing or business analysis.
But in reality, quantitative data is at the heart of mobile design. Whether you want to optimize a particular task flow, measure your audience’s satisfaction, or validate the business value of your design, metrics play a key role.
We’ve come a long way from just measuring the total number of downloads. If you want to validate your app’s design with user data, you have to look at the right indicators.
Here’s a short list of the key data points for mobile design.
1. Activation rate
Activation rate measures the number of people who complete the onboarding process and activate your app versus those who only download your app.
In the past, less specific measures like total numbers of downloads were used to measure audience growth. But the flaw in that metric is obvious: not everyone who downloads your app will actually use it. Activation rate provides a true indication of how effectively you’re onboarding new users and growing your audience.
For companies that charge a monthly fee, activation rate can have the most impact on increasing monthly recurring revenue (MMR) out of any other metric. In addition, designers are uniquely positions to increase user activations and generate better business results.
Activation rate is heavily influenced by the user experience of your onboarding process, which is solely design’s responsibility. Optimize your onboarding process, and watch your activation rate climb.
For example, Betterment’s onboarding is quite complex, but you can be sure the company’s designers have worked diligently to optimize the process.

2. User satisfaction
Technically, user satisfaction can be either qualitative or quantitative. For this article, we’ll keep our focus on the quantitative side.
User satisfaction is generally calculated in one of two ways:
- Customer Satisfaction Score (CSAT): users rate their satisfaction from 0 to 5.
- Net Promoter Score (NPS): users rate their satisfaction from 0 to 10. People who are less satisfied are labeled as detractors, while people who respond with a higher number are classified as promoters.
Whichever method you use, it’s important to maintain an updated calculation of your users’ satisfaction. This provides you with a baseline to reference when you make major changes in your app.
Does customer satisfaction dip or spike when you test a new design? If you have a baseline for customer sentiment, you’ll have a more exact idea of how people respond to your design.

What’s more, better customer satisfaction is linked to a host of business benefits, like positive ratings, more referrals, and increased retention.
All of these outcomes are critical for mobile apps, but let’s think about retention for a moment. Research suggests that just a 5% increase in user retention can lead to a 25% increase in profitability.
3. Goal completion
One of the most accurate ways to measure the usability of your design is to monitor goal completion.
Goals are typically a series of tasks that users need to complete in order to utilize one of the primary functions of your app. For example, if someone’s goal is to make a purchase, then they’ll need to visit a product page, enter some information, and checkout.
As the name implies, goal completion records the percentage of people who finish the series of tasks that constitute a goal versus the total number of people who began the process.

Above, you see how Google Analytics visualizes goal completion as a funnel. Goal completion is measured as the percentage of the original cohort who completed all the of tasks—in this case, the people who paid and checked out of an ecommerce store.
Optimizing goal completion is yet another chance for designers to influence business results. Unless your app relies purely on ad revenue, you’re going to have a subscription or purchase option. Using goal completion to optimize your checkout conversion is one of the most direct actions you can take as a designer to drive revenue.
Understanding goal completion also helps designers identify which user interface patterns are most effective, which can make your entire design system more effective.
4. Drop off rate
A partner measurement to goal completion, drop off rate analyses how many users abandoned your app at each step in the goal completion process.
For example, if online shopping requires five steps to check out, then you’ll have a percentage of people who stopped the process at one of those five tasks. Understanding where people abandon ship in the process helps pinpoint areas that probably need better UX design.
Here’s another example from Google Analytics. Each step in the funnel we mentioned above has a drop off rate denoted in red.

Does that navigation need to be larger? Should users have less options? Was that form field too aggressive?
Monitoring when people leave you app will help you form hypothesis and start uncovering answers. And if you address drop off rate at critical moments—like on a checkout page—then even small numerical increases can yield substantial results.
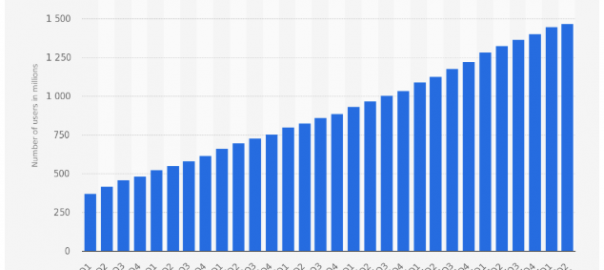
5. Daily active users (DAU) and monthly active users (MAU)
Active user numbers have replaced downloads as the true indication of an app’s success.
These numbers are simply a more accurate representation of your audience, and they allow businesses to understand how important their app is to their users.
Do new users return often? Is our total number growing month over month? Along with MMR, these are the questions burned into the memory of every product manager and executive.
Of course, user metrics are a little outside of the purview of design. Sure, a better user experience can do wonders for retention, which will increase both metrics. But factors like marketing and your app’s technical performance also play a huge role.
Still, these are important metrics to know. If you want to correlate design to business performance, you need to speak the right language.

After revenue, Facebook’s success is measured in daily active users. Above you can see the rise in daily active users over the years.
In conclusion
To be clear, the world of mobile data is vast. And there are other important metrics to know that haven’t been mentioned here.
However, the above five metrics are vital for design. We use them when we create mobile applications for clients, and if you do the same, you’ll be much more informed about how your design is performing, and how it’s affecting the bottom line.
Digital & Social Articles on Business 2 Community
(87)