Tag Archives: Infographic

How to Tap Into the Law of Employee Attraction [Infographic]

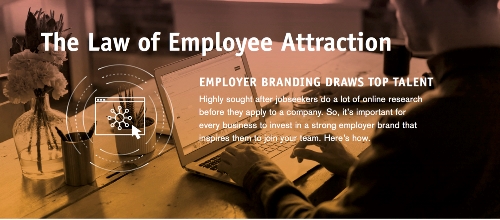
Jennifer Hanford — December 20, 2016 Follow @jennghanford— December 20, 2016 Does an employer’s online activity affect the type of talent they’re able to attract? How about their branding? Column Five collaborated with analytics-driven recruiting software company Jobvite to create an amazing infographic called, “The Law of Employee Attraction.” Their infographic provides information and statistics … Continue reading How to Tap Into the Law of Employee Attraction [Infographic]

How B2B Marketers Generate Revenue — State of Pipeline Marketing 2016 [Infographic]

Lauren Frye — December 17, 2016 — December 17, 2016 The reality that B2B marketers can have a huge impact on real-time revenue results is not a new concept to today’s B2B marketing community. But the question remains — how do marketers actually generate revenue? Which metrics are B2B marketers using? What does their channel … Continue reading How B2B Marketers Generate Revenue — State of Pipeline Marketing 2016 [Infographic]

10 Empowering Stats Every Person In Sales Should Know [Infographic]

Andrew Gazdecki — December 16, 2016 Follow @biznessapps— December 16, 2016 Sales can easily breed complacency if you are not careful—especially when you get into a routine and deal with primarily with a stable and regular client base. But the slightest shakeup in a company can send you scrambling to keep your clients. Here are … Continue reading 10 Empowering Stats Every Person In Sales Should Know [Infographic]

16 Local SEO Fixes to Ramp Up Your Rankings in 20 Days [Infographic]

Itamar Gero — December 15, 2016 Follow @ItamarGero— December 15, 2016 The rise of mobile usage brought a tremendous impact on user behavior, which, in turn, has an effect on the local search landscape. It’s not just about chasing links anymore; it’s about getting accurate NAP citations and driving more signals from business listings to … Continue reading 16 Local SEO Fixes to Ramp Up Your Rankings in 20 Days [Infographic]

How to Deliver Experiences That Strike a Chord [Infographic]

Ben Tepfer — December 13, 2016 Follow @bentepfer— December 13, 2016 Brands that master cross-channel personalization now have the power to create consistent customer experiences and foster deeper “experience loyalty” with consumers. It’s imperative that all marketers overcome the barriers to cross- channel personalization and create the kinds of memorable experiences that keep customers coming … Continue reading How to Deliver Experiences That Strike a Chord [Infographic]

Create A Killer Social Media Strategy [Infographic]

Louis Foong — December 12, 2016 Follow @thealeagroup— December 12, 2016 Facebook, Twitter, Snapchat, Instagram, Periscope, LinkedIn … the list of platforms used by marketers goes on and on. Why the intense focus on social media marketing these days? It’s where your customers are: 74% of adult internet users are active on social media and … Continue reading Create A Killer Social Media Strategy [Infographic]

11 Easy Ways You Can Improve Your Organic CTR [Infographic]

Bob Hutchins — December 8, 2016 Follow @Bobhutchins— December 8, 2016 Click-through rate (CTR) isn’t a topic that gets many people fired up… but we can’t emphasize enough just how important a metric CTR is. Clicks lead to sales and conversions, and earning that click, whether through paid social advertising or content marketing, is one … Continue reading 11 Easy Ways You Can Improve Your Organic CTR [Infographic]

10 Productivity Hacks to Transform Any Business Meeting [Infographic]

Louis Foong — December 7, 2016 Follow @thealeagroup— December 7, 2016 I wanted to talk about something a little different today – it’s an issue that almost every business has to deal with at some point or another and many businesses deal with on a regular basis. I want to talk about wasteful meetings. About … Continue reading 10 Productivity Hacks to Transform Any Business Meeting [Infographic]