— May 30, 2019
We’re often told that in today’s world data is king. While there’s certainly truth to that statement, sometimes having too much information can be as bad as not having enough. In fact, too much data can blind easily us to truly important insights.
Over a third of marketers suffer from data overload.
That is, they know more about their customers than they know what to do with. This creates a whole host of problems. It’s inefficient. It makes it hard to know if you’re making the right decisions. It’s also just downright stressful.
To an extent, this problem is facilitated by the tools we use to analyze customer data. The problem isn’t with the tools themselves per se. Rather, we have the power to drill so deeply into our customers that it’s hard to know when to stop.
Take Google Analytics.
It’s the most popular analytics suite there is. There are also a host of Analytics tools that the platform supports.
From local bakery owners to behavioral marketing gurus at blue-chip companies, most people use Google Analytics to understand what is happening on their website. Yet how they use the tool varies immensely.
In reality, a lot of businesses don’t get further than a look at the number of site visitors or time on site. While these metrics are important, there is a reason that experienced marketers consider them to be vanity metrics. What companies with a limited budget and a business to run really need is a little bit of behavioral marketing know-how.
This means having a concrete strategy for segmenting and tracking your customers.
A Crash Course in Segmentation
Everyone likes to think that they’re a unique individual. In reality, this isn’t exactly the case. At the very least, it’s not so very difficult to group your customers into broad categories, otherwise known as audience segments. How you segment your audience will be based on certain indicators.
These come in two flavors static and dynamic.
Static indicators are things which don’t really change, at least not often. These are your audiences innate characteristics. The main examples are things like age, location, gender, income bracket and level of education. These are all available in Google Analytics by default, so you don’t need any wizardry to split your audience this way.

The first step to creating static segments is thinking about your ideal customer. You probably already have an idea of what this is. The thing to do here is to test this out and see if what you think about your ideal customer hold up to scrutiny.
To do this, head over to the ‘Audience’ page in Google Analytics. Then hit ‘Overview’ and ‘Add Segment’ and simply key in what you think is your ideal customer.

There’s more information on how to do this in the Analytics help guide.
If this group makes up a significant portion of your customer base then you’re in business. On the other hand, if you haven’t ever analysed your data there’s a good chance that there will be some surprises. This is often an issue for large companies where there is a separation between the sales and marketing departments.
Once you’ve got a firm handle on the demographics of your main customer base, you need to exclude them from the remainder of your web traffic to try and figure out who else is buying your products, using the ‘Demographics’ ‘Interests’ and ‘Geo’ tabs.
Doing this, you can create additional static segments of smaller, but still significant types of customers.
Good Behaviour
The second way to segment your customer base is using dynamic indicators. These are things which frequently change. Examples include customer behaviors, such as bounce rates and sources of traffic, as well as what devices they use.
Whether someone is a first-time or repeat buyer also falls into this category. You could even segment people along the lines of their average spend, or the total they have spent on your site.
In Google Analytics, these can be found under the ‘Behaviour’, “Technology’ and ‘Mobile’ tabs.
You can also use the ‘Custom’ tab to add a range of indicators related to your other marketing activities, especially when used in conjunction with other tools. This might include things like users who regularly open your newsletter or who follow you on Facebook.
Dynamic segmentation is useful for figuring out your customer’s buying journey, which can help you focus your efforts. For instance, if you have a higher conversion rate with users who visit your site more than once, you’re efforts should be put into drawing repeat traffic rather than looking for new users.
One useful trick for getting to grips with this is simply dividing your customers into those who made a purchase and those who did not. More than likely, your non-buyers will be first-time visitors.
Using this trick can also help you to go back and rethink static segments, as well as telling you who your messaging is landing with.
Keeping Track
When you start pulling all this together it really becomes fun. You’re probably already thinking that your different static segments probably have slightly different buying journeys. And you’re right!
Some demographics are naturally a little bit more willing to part with their money than others. By contrast, some people probably like to do a little bit more research to determine exactly the right product for them.
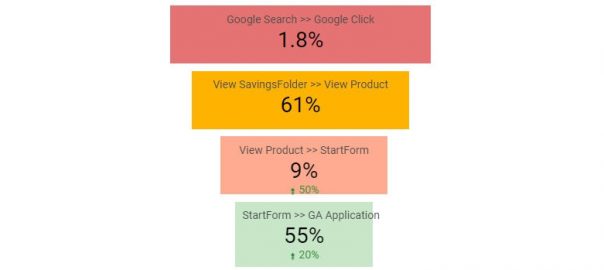
Combining static and dynamic segments lets you figure out the different typical buying journeys for your various target audiences. You can use this kind of information to help you fix leaks in your funnel. With the right support, you could visualize this through a custom Google Analytics dashboard.

In any case, once you’ve built a clear picture of the buying process for each of your main static segments, it’s time to start thinking about individual users, using Google Analytics’ ‘User-ID’ function.
This is simply a way of tracking a single user’s interactions with your site across different sessions and platforms. The goal is to follow their journey from the first contact, all the way through your sales funnel.
Obviously, what you actually do with this information depends on your specific business and the Key Performance Indicators you are using. Initially, you might want to push first time traffic towards returning to your website through targeted Facebook ads.
Equally, if a repeat visitor needs an extra push, it could be appropriate to incentivize them with a coupon in their email inbox, or simply some extra information about why your product is right for them.
Final Thoughts
Marketers often get overwhelmed when they don’t know what to do with all the data at their fingertips. This leads to suboptimal results and wasted time and money. Obviously, no-one wants that.
Normally, part of the problem is that they’re using powerful analytics tools without a clear idea of what they’re doing or what their goals should be. To combat this, I’ve provided you with a framework for what the fundamentals of your audience analysis should look like.
At its core, this has three stages. Firstly, segmenting your customers into target audiences using static indicators. Second, mapping out the customer journey for each of these using dynamic indicators. And finally, tracking individual users’ positions within these buying journeys.
With these fundamentals in place, you’ll be able to add whatever automation wizardry and fancy data modeling you want on top. More importantly, you’ll always have a clear idea of the core purpose of audience analysis to refer back to.
Then you’ll be unstoppable.
Digital & Social Articles on Business 2 Community
(63)