— May 16, 2019
")
377053 / Pixabay
Knowing how different marketing channels work together to drive conversions and sales is key for marketers, and the various Google attribution models available can be useful tools for examining your data from one angle or another.
But that array of options often creates more confusion, rather than insights. Which attribution model gives marketers the best picture? That’s the question we’ll tackle in this post, by analysing the pros and cons of the 6 main Google attribution models.
(Look out for part 2 later this week where we’ll show you a model that overcomes all the weakness of these models below.)
What is a Google attribution model?
An attribution model is a set of rules Google Analytics/AdWords uses to map conversions and sales to respective touchpoints in a customer’s journey. People come to your website through different channels:
- Paid and organic search
- Referral links
- Affiliate links
- Social media networks
- Emails
- Direct URLs and custom campaigns you’ve set up.
Attribution modelling shows you which ones bring in the most sales and which ones assist conversions – the marketing actions/channels that contributed to sealing the deal. But being a descriptive analytics tool, GA can only tell you how users interact with your website and other properties before converting.
It prescribes the right actions or predicts how conversions will change if you optimise a certain channel – it’s your job to properly capture and interpret all the available data. Arguably, that’s the hardest part of any marketer’s job. But that’s where data science can help.
There are several Google attribution models you can consider in Google Analytics:
")
1. The last interaction attribution model
The credit for sale (conversion) is assigned to the last platform or channel that a user came from before converting.
")
Example: you are hosting a webinar and place a link to your product in the description box. Out of 100 attendants, 10 clicked that link and signed up for your tool. According to the last interaction attribution model, 10 sales will be credited straight to the webinar platform (referral traffic).
Sensing a fallacy here? This model does not account for all the other marketing activities you’ve used to generate the buzz around your webinar – that aggressive email campaign you did; the paid social media promotion and all the blog posts you’ve published to gather a warmed up, relevant audience for your event. The last attribution model does not account for all the other touchpoints a user probably had before converting.
Pros
- Relatively easy-to-setup. Most analytics tools (except for Google Analytics) use this attribution model as default.
- Delivers straightforward insights into cost-per-lead metrics.
- Provides data into what’s driving the bottom of the funnel, one step away from conversion.
Cons
- Tracks only the last steps in the buyer’s journey.
- Gives you limited visibility into assisted conversions; diminishes the role of other mediums in your campaign.
- Can leave you with a strong impression that only a few (or one) of your marketing channels work, while others show zero conversions (even if that’s not the case).
2. The first interaction attribution model
All the credit goes to the first touchpoint a customer had with your brand. You assume that once the person is there, nothing else can push them towards or derail from converting.
")
Example: Tim googled your blog post. Two weeks later, he clicked a display ad or typed in the website URL directly and placed an order. Organic search will get full credit. Other actions are not considered.
Pros
- Simple and straightforward way of measuring demand generation.
- Good choice for businesses using a few (under five) marketing channels to determine which ones drive the most brand awareness and top-of-the-funnel customers.
- Suitable for companies with short buying cycles and sales funnels designed for immediate conversions – (saw and purchased).
Cons
- Similarly to the previous model – you don’t get insights about assisted conversions/other channels.
- Limited CRO: without knowing what exactly impacted the conversion, you have little room for experiments and optimisation.
- Unsuitable for measuring the results of omnichannel digital marketing campaigns or for companies with long sales cycles.
3. Linear attribution model
This one accounts for every touchpoint a customer had with your business before converting. All the involved channels receive equal credit for each sale (e.g. 50%-50% or 25%-25%-25%-25%).
")
Example: Jane takes the time to interact with your brand before converting. She stumbles on your blog post (organic 25%) + clicks on your tweets (social media 25%) + checks your email newsletter (25%) + types your website URL directly and buys a subscription (Direct 25%).
Pros
- Provides visibility into every channel that drove conversions. An easy gateway to multi-touch attribution analysis.
- Allows you to optimise different campaigns/channels, matching different steps of the customer journey.
Cons
- Not every channel has equal impact on conversions. Yet, this model assigns equal credit to low-value touchpoints (e.g. social media clicks) and high-value touchpoints (e.g. pricing requests). You cannot determine what channels/activities work best and where to pour more budget.
4. Position based attribution model
In this case, different touchpoints get fairer “weights” based on their position in the user’s journey. The first and last touch points receive a 40% credit allocation as they are deemed more important than what happened in the interim.
")
Example: Leo found your brand on Instagram (40% social media). He subscribed to your newsletter and clicked a link (20% email). Later he placed an order through an affiliate link shared by his favorite blogger (40% affiliate).
Pros
- A more realistic representation of modern customer journeys. Every touchpoint is credited to some extent. You can also determine the two main channels (first and last) for further optimization.
Cons
- Over-emphasises the importance of the two touchpoints, while neglecting others. The percentage allocation may not realistically represent your business sales cycle and the value of individual campaigns. Should a generic email newsletter be given more credit than a niche Facebook retargeting campaign?
5. Time decay attribution model
Touchpoints taking place closest in time to sale/conversion receive the most credit. In other words, the first click has the least value, the last one reigns supreme. But every action in between is measured as well. For additional accuracy, you can add a half-life for a certain decay. The touchpoint at that period will receive 50% of the credit of that final touchpoint.
")
Example: Lisa navigated to your website via a search ad (10%). Later she found your website again by googling it (15%), subscribed to your newsletter, and clicked back just in time for sales (25%). But her shoe size was not in stock, so she came back directly a few days later (50%).
Pros
- More accurate weights are given to every channel/interaction that drove conversion with most credit assigned to the last action that “sealed the deal”.
- Helps optimizing conversions and assisted conversions. Well suited for businesses with long sales cycles.
Cons
- Fails to acknowledge the importance of brand awareness campaigns that placed your brand in the customers’ spotlight.
- Due to being linear, this model does not fairly highlight the more important touchpoints e.g. webinars and email marketing could have more impact on conversions earlier in the journey than that final conversion through a direct link.
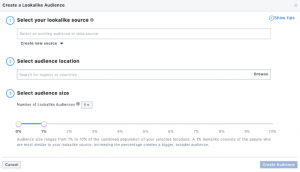
6. Custom attribution modeling
The proposed attribution models can be further customized with additional rules and benchmarked against one another using the Google Model Comparison Tool. Custom modeling gives you more room for reconciling the analytics with the actual customer journeys. However, it will still assign the same predetermined weights to different channels.
")
So if every model is flawed in one way or another and does not provide a full picture, what’s a business to do? The answer is the data-driven attribution model, available to Google Analytics 360 customers.
Unlike others, this model leverages actual data from your account to generate a custom model, personalized to your business, for determining various touchpoints throughout the entire customer journey and assigning custom credit weights to them.
Part two of this series will cover all the basics of setting up and using data-driven attribution, with real-life examples from our team. Stay tuned.
Digital & Social Articles on Business 2 Community
(81)