Ecommerce Paid Channel Use Declines – A Problem For Search

The average number of paid channels used by any one ecommerce company fell to 2.7 in 2023 — down from 3.2 in 2022 — and that could become a major challenge for search engines supporting any type of paid advertising or search engine optimization (SEO).
The U.S. experienced the most significant decline of 25% in the number of channels used by retailers in 2023 — 2.3 compared with the previous year.
This downward trend may be partly attributable to the 30% of advertisers that have decreased ad budget for 2023, according to Insider Intelligence.
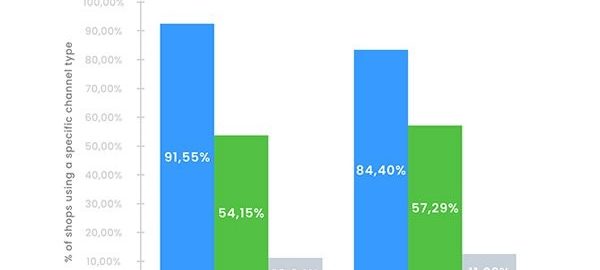
Contributing to the decline, ecommerce advertising is getting a boost from social channels, not search. As a result, the use of search channels fell by more than 7 percentage points between 2022 and 2023, according to data from DataFeedWatch.
The study is based on sample data snapshots from more than 50,000 feeds from shops with various catalog sizes, millions of products, about 20,00 ecommerce sectors from Apparel to Media, 300 advertising channels, and 60 countries.
Specifically, 27.4% of the feeds were from the U.S., 57.4% were from European countries, and the remaining 15.2% were gathered from the rest of the world.
Not all advertisers in all regions have reduced the number of channels.
Advertisers in East Asia have increased their use of channels to 4.4 channels in 2023, compared with 3.7 in the previous year. This growth has led to a significant shift in their rank in the study, with the region now listed in the report at the very top.
With East Asia in the lead, the top 10 also include Austria with 3.6; UAW, 3.5; Belgium, 3,4; Italy, 3.3; Germany, 3.3; Poland, 3.2; the Netherlands, 3.2; Switzerland, 3.1; and Ireland, 3.
The top 10 channels used in the electronics sector in 2023 include:
1. Google Shopping
2. Custom channels
3. Facebook
4. Amazon
5. Google Search Ads
6. eBay
7. Microsoft Ads
8. PriceRunner
9. Criteo
10. Partner-ads
In fashion, the list of the top 10 channels look quite different:
1. Facebook
2. Google Shopping
3. Custom Channels
4. Pinterest
5. Microsoft Ads
6. Criteo
7. Awin
8. Amazon
9. TikTok
10. Google Search Ads
For marketers looking to expand reach through international advertising, the study suggests starting with ads that are not in the company’s native language can serve as a quick way to enter the market, but the drawbacks are low visibility and possibly lower conversions.
Nearly 1 in 4 product listings in a given country is displayed in English. Countries like Saudi Arabia, the United Arab Emirates, Portugal and Mexico are leading in the adoption of English product ads. They have an average of more than 20% of product feeds submitted in English rather than the primary language of the target country.
Affiliate channels remain a “fairly underexplored type of advertising.” The study estimates that only 11.02% of advertisers use this type of advertising.
Affiliate marketing in Canada and the U.S accounts for 16% of ecommerce sales and has seen a steady increase in interest over the past 6 years, the report notes, citing Google Trends, which could suggest future growth potential for advertisers using this channel type.
Discounting products online appears to be gaining in popularity. The study shows that 30.66% of all products advertised online are on sale as of Q2 2023. There was an increase of nearly 14% in the number of discounted products in 2023 compared with 2022.
The combination of growing inflation and cost-conscious consumers continues to push retailers to offer more discounts, but those discounts — depending on the frequency— suggest that advertisers may be facing increased competition for the best ad placements.
And certain product categories are turning to discounts more than others. Furniture in Q2 2023 led in discounts with 48.51% of products on sale. Food, Beverage & Tobacco, and Apparel & Accessories sectors followed with 41% and 35.72% of products offered at a promotional price, respectively.
The report also states that average discounts applied to products increased slightly from an average of 33.18% in Q4 2022, to 33.94% in Q1 2023, to 34.82% in Q2 2023.
The Electronics sector has had the highest discounts, with a 38.02% discount on average. Media follows with 37.97%, and Apparel & Accessories at 37.71%.
Toys & Games came in with a 21.22% average, but the lowest discounts were in staples — Food, Beverages & Tobacco — with 18.8% markdowns seen on average.
(12)