The Idea
In a perfect world, an e-commerce company could accurately attribute all of its costs and revenue across each of their paid channels.
Using such data, that same company could then allocate their marketing spend more efficiently and set up their remarketing and retention programs to maximize customers’ lifetime revenue.
Unfortunately, we don’t live in a perfect world and the difficulty of driving acquisition from multiple marketing channels (organic search, paid search, email, Facebook, display, etc) is that these sources can double count conversions and revenue.
Without purchasing an expensive software to extract insights from your preferred attribution model, it’s difficult to derive the true profitability of each channel.
Since we’re all about making our clients’ lives easier, we devised a method that connected readily accessible data from Facebook and our clients’ customer databases – with a dash of logical reasoning – that provides a much clearer picture of the lifetime value of their consumers and marketing channels.
One of the most intriguing outcomes of this approach was with an online marketplace that connects consumers with more than 1,000 professional services like house cleaning, singing lessons, photography & personal trainers.
In collaboration with this client (let’s call them “Mercado”), we sought to understand the lifetime value of customers who converted through Facebook.
The Background
This company has been with us for more than two years, and we’ve seen consistent success meeting their CPA goals and growing their spend.
We had been using only same-session attribution for tracking our success, meaning the customer clicked on the ad and converted on Mercado’s website shortly thereafter. And despite the great results we were seeing, we still felt we could capture a more accurate picture of their campaigns if we could better understand the consumers converting through Facebook.
By proving a higher lifetime value of conversions, we could continue to scale their campaigns with more effective targeting and increase their volume and bottom line.
Facebook can measure performance based on all conversions within a 28-day window. Mercado, however, offers numerous services that involve long decision cycles. It takes some customers months to convert after their initial engagement, so we needed to look at conversions over a longer time period.
The Questions To Answer
Given the breadth of services offered by Mercado, we were looking for the specific types of services, such as plumbing, or a range of services (like the various things you need for wedding planning) that showed the greatest difference between same session and lifetime revenues.
By identifying where the greatest differences arose, we could spend the marketing dollars more efficiently.
We were looking at two major questions with our research:
- Which campaigns drove the highest repeat rate and highest value categories of services?
- Are there any other dimensions we are not currently considering?
The Process
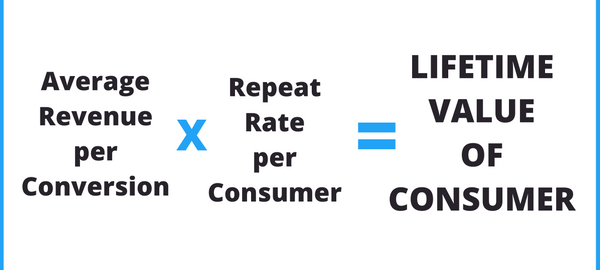
THE EQUATION
To answer those questions, we needed to calculate the lifetime value of the consumer for each and every campaign we’d run.

THE DATA
The first step in this process was to pull the data for two sets of information:
- From our Facebook campaign data on conversions since January 1st, 2015.
- From Mercado’s customer database of every customer who had ever clicked on a Facebook ad since January 1st, 2015.
Here’s the data we pulled:

Here’s where we get into the nitty-gritty of determining the lifetime value of these consumers, so bear with me.
After we pulled these two sets of data, we matched them up using their one common denominator: the customer ID.
Regardless of whether the customer had converted multiple times or not, we were able to track where they initially came from, so we knew where to attribute their value.
FINDING THE AVERAGE REVENUE PER CONVERSION
Mercado advertises their service categories one of two ways: Either they promote a specific service (ex: dog massages) or they showcase these as part of a related category (ex: dog spa services).

To determine the Average Revenue per Conversion, we needed to:
- Determine the distribution for all of the converted services
- Break down this distribution by both the campaign and the advertising format (i.e. whether it was for a specific service or an overall category as shown above.)
- Then we had to discover whether the consumer ultimately converted for the same service or a different one from the Facebook ad they clicked on
Here’s an example to better illustrate that second point:
Say that Trudy found Mercado because of a campaign we ran promoting plumbing services. However, after spending time on Mercado’s site, she instead converted on painting services, and not plumbing.
To get an accurate picture of the revenue that this conversion generated, we would attribute it to painting instead of plumbing.
EARLY IMPRESSIONS
We found that the more specific the campaign, the higher percentage of conversions for that specific service.

We also found that despite campaigns specifically promoting one service (such as dog massages) there were a small percentage of customers that converted for other services unrelated to the ad once on Mercado’s website.
Since our goal was to find the average revenue per conversion for each campaign, we had to do some additional number crunching.
To get the average total revenue per conversion, we used data from Mercado to find the percentage of conversions for each category and multiplied it by the average revenue per conversion for that category.

ANALYSIS OF AVERAGE REVENUE PER CONVERSION
Even though this campaign promoting dog massages allegedly generated $ 9.14 in revenue for each conversion, it was only after the analysis of all of the other categories that converted that led us to the $ 9.56 in average revenue per conversion.
To accurately gather the return on your campaigns, you have to analyze all of the categories that convert from the traffic generated by that advertising campaign.
Only after you multiply the conversions for each category by its revenue can you determine the true overall value of your Facebook campaign.
FINDING THE AVERAGE REPEAT RATE OF CONVERSION BY CATEGORY
Next, we looked at the average repeat rate of conversions by category.
This took slightly less number crunching, as all we had to do was determine whether or not the customer had converted more than once.
What we found was a fairly wide range:

Outside of our dog themed examples, the real data showed that the lower end of the spectrum was mostly one-time home services (ex: plumbing, home repair, or interior painting), while the higher rate of conversions usually involved event planning (including one wedding planner who converted 52 times!).
This range of conversions makes sense when you look at the specific services that are converting.
Planning an event like a wedding almost always involves engaging a large number of vendors, whereas a homeowner may have a need for a single service only once.
EARLY IMPRESSIONS
Previously, our target CPAs assumed a single conversion. The fact that the data showed such a wide range meant that this assumption could have been preventing Mercado from earning greater revenue down the road.
The Final Equation
After we compiled both the average revenue per conversion as well as the average rate of conversion per category, we could use our original equation to calculate an estimated lifetime value for consumers.

The services with the highest ROI differences were also the ones with the highest repeat rate. Yet, the difference between the service someone converted on versus the advertised service could represent a large revenue difference as well.
For instance, the Dog Brusher category seems like a poor performer when you look solely at the same session revenue ($ 10.66) compared to the cost to acquire that consumer (CPA of $ 16.29).
But this is where the Lifetime Value equation comes into play.
When we consider the average total revenue per conversion ($ 13.34) times the average number of conversions (1.78), we get an LTV of $ 23.75.
Mercado’s ROI for Dog Brusher services is actually 80%!
With an LTV that outweighs the CPA for this category, Mercado is getting major bang for their buck with this campaign.
Conclusion
Assuming other campaign costs are relatively low, utilizing the LTV equation can show whether or not a campaign is truly profitable.
The LTV equation also keeps us from downplaying campaigns that may not look profitable based on their same session revenue, but end up being quite profitable after considering their lifetime value.
The Takeaways
There were three main takeaways we learned from all of this analysis:
(1) INVEST IN RETAINING CUSTOMERS
Based on the increased LTV of services with a high repeat conversion rate, there’s a clear benefit to building extensive retention programs where we show services similar to the one the user originally converted from within a new campaign.
Given that users are already familiar with Mercado (and presumably satisfied!), costs of acquisition should decrease for these users.
PRO TIP: Test various lengths of time around retargeted audiences (7-day, 30-day, 90-day, etc.). Base this range of options on the original conversion category. Every business is different, and hitting your customers at the time when they most need your product or service is key.
(2) FOCUS SPEND ON AD TYPES THAT CONVEY THE MESSAGE
In our attempt to increase a consumer’s repeat conversion rate, we increased our spending on Facebook Carousel ad units so we could market multiple services within a particular category.
Our targeting on Facebook excels at finding users who are homeowners, and showing those users multiple services at the same time increases the chance that the specific service they’re looking for is there.
Plus, given the added value of high repeat rates, we want the user to be sure to think of Mercado whenever they need those additional services.
PRO TIP: Figure out what drives your highest LTV customers, and focus your spend on ads or ad types that will help create new, high-LTV customers.
(3) TEST INTELLIGENTLY
Whether they be small business owners, commercial property managers, or pet owners, we test the services with the highest promise for repeat business, and apply the strategies listed above.
PRO TIP: Consider the purchasing cycle of your goods and services and test those that may lend themselves to high repeat conversion rates.
Digital & Social Articles on Business 2 Community(105)