Google Analytics is the most accurate and sophisticated ways you can measure the success of your digital strategy and the various SEO methods you are using to drive traffic to your website. Alongside Google Search Console, it is probably the most important tool in the toolbox of any SEO.
Google Analytics measures and records the traffic coming into your website but that’s really only the tip of the iceberg. The data that Analytics captures is incredibly granular and can be broken down in – what can be at times – an intimidating number of ways. It is the job of a good SEO company to interpret this data, present it in the right way and adjust strategy accordingly. The efficacy of Google Analytics is really dependent on the individual who is using it. It’s easy to see a dip in traffic but using Analytics to understand why that has happened and taking action to address it, is what counts.
Whilst this article can’t teach you how to react to every dip and spike in your website traffic, it can hopefully help you to interpret the data you find in Google Analytics. First of all, though, you need to connect Google to your website.
Setting Up Google Analytics
There are several stages to go through to ensure Google Analytics is setup and recording data accurately. You will need Edit permission at account level to do this:
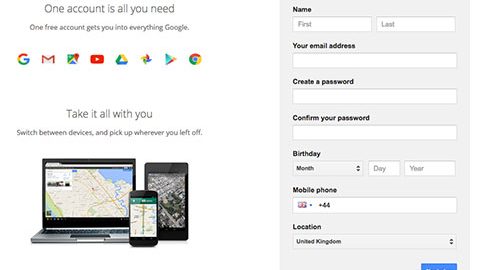
- Set up an analytics account if you don’t have one already. If you do have one then sign in.

Setup your Google Analytics account
- Set up a property in your analytics account. Click on Admin in the left-hand menu and select the account from the drop down menu. Now in the PROPERTY dropdown to the right of the ACCOUNT dropdown select Create new property.

Setup New Property
- Select Website and enter the website URL you want to track data for, making sure to include HTTP or HTTPS at the start and leaving our any trailing slash at the end.Select the industry and reporting timezone and click Get Tracking ID. This will generate a short piece of Javascript tracking code.
- Select the industry and reporting timezone and click Get Tracking ID. This will generate a short piece of Javascript tracking code.
![]()
Google Analytics Tracking ID
- Copy and paste the tracking code into your website <head> tag. Many web hosting services and content management systems, such as WordPress, will give you the option to just enter the code into a single field, automatically adding the code to each page on your site. For more details on adding the tracking code to your site, see this guide.
Ensuring Google Analytics is setup and accurately capturing data relating to your website will form an integral part of a proper website audit. This will ensure that any other relevant stages are completed such as setting up filters, so you aren’t capturing data from individuals who are accessing the site on a regular basis who aren’t potential customers. This could include employees of the company and any external SEO agency, website developers or digital marketing consultants.
I won’t go into details about filters here as it could warrant an article all of itself but Google has some good guides and videos to get you up to speed.
An SEO audit will also set up goal tracking, if appropriate at this stage. This will help you track specific actions from visitors and assign a monetary value to those actions.
The tracking code can also be modified to record events such as interactions with certain buttons and links. On e-commerce sites, for example, this can help you establish the efficacy of your purchase funnel and checkout process.The Google Analytics Interface
The Google Analytics Interface
The Google Analytics interface can seem daunting at first but don’t panic. It’s likely that you will only be using a fraction of it so it’s just a case of knowing what menus to access and what data you are looking at.
The first thing to mention is that the data you view will relate to the date range selected in the top right box. You can select as long or as short date range as you like to get a short or long view of your website performance. Many of the charts produced can also be set to view in hourly, daily, week or month views. This will make visualising data easier for longer and shorter periods accordingly.

Set Date Range
Google Analytics Reports and Views
The left-hand menu has several sections, each with their own sub-sections. In reports, these are then broken into further sections. It is beyond the remit of this guide to go into detail on every single report view in Google Analytics, so we will turn our attention to the most incisive for the average small business website. Audience
Audience
- Overview: The audience overview is probably the most comprehensive high-level report you can view in Google Analytics. On a single page, you can see sessions, users, page views, pages per session, average session duration, % of new sessions and bounce rate over time. It also gives you a pie graph of new visitors vs return visitors and a quick breakdown of traffic by demographics, browser, OS, mobile OS and service provider.

Audience Overview
- Geo: This is a really effective way of seeing whereabouts in the world your traffic is coming from. The Language view breaks all the standard data in the overview down by language, whilst the Location view represents this data on a map of the world

Geo
- Behaviour: The behaviour section allows you to drill down into how traffic is behaving once it’s on your site. This includes all the standard metrics on New vs Returning visitors. It also allows you to see Frequency & Recovery (visitors broken down by session count, days since the last session). A more specialist Engagement view allows you to see sessions broken down by session duration and page depth (number of pages viewed in a single session).Acquisition
Acquisition
- Overview: Like the audience overview, the acquisition overview gives a good all round picture of how you are acquiring the traffic you’re getting. This includes a pie graph split by organic, direct, referral and social traffic. This is also broken down by all the standard metrics in a comparative bar chart. Sessions and goal tracking graphs are also included for quick reference.
- All Traffic: This subsection includes a number of very useful views, which include:
- Channels: Traffic is broken down by channel, which are organic search, direct, referral, social and email. These are then broken down by all the standard metrics. This can be further drilled down into by clicking on any one of these groups. The primary channel can then be changed so you can compare traffic by landing page and, in the case of organic traffic, keyword.
- Source / Medium: The primary dimension can also be changed from the default channel grouping so you can compare traffic by source, medium or both. This can be done from within the channel view (at the top of the table) or in this separate subsection.
- Referrals: This is an extremely useful view if your campaign strategy involves pulling in traffic from other sources other than search. If you are building links to your site through guest blogging, for example, this will show you if these articles are delivering you any traffic. The primary dimension in this view can be changed from source to landing page showing you what pages on your site are getting the most referral traffic.Social: The social view breaks all your traffic derived from social networks down. If social media marketing is a big part of your digital strategy then some of the views in this section will be essential. These include social traffic by Network Referrals, Landing Page, Conversions and even Plugins.
- Channels: Traffic is broken down by channel, which are organic search, direct, referral, social and email. These are then broken down by all the standard metrics. This can be further drilled down into by clicking on any one of these groups. The primary channel can then be changed so you can compare traffic by landing page and, in the case of organic traffic, keyword.
- Social: The social view breaks all your traffic derived from social networks down. If social media marketing is a big part of your digital strategy then some of the views in this section will be essential. These include social traffic by Network Referrals, Landing Page, Conversions and even Plugins.

Channels
Behaviour
- Behaviour Flow: This is a very useful view and one we use in our own website audit reports, as it is a powerful graphical representation of how traffic flows through your site and what landing pages are driving the most useful traffic. This report is highly customisable allowing you to set up your own page groupings and adjust the level of detail. For websites with hundreds of pages, you can also zoom in and out which is very useful.

Behaviour Flow
- Site Content: This set of reports shows you traffic as it relates to individual pages on your site. You can view by All Pages, Landing Pages and Exit Pages, as well as a Content Drilldown view, that lets you view pages grouped by top level folder paths.
A Final Word on Conversions and Goal Tracking in Analytics
It’s worth pointing out before we end this guide, that we have only really touched on this subject. Google Analytics is extremely diverse and contains many different reports and a host of functionality that we haven’t covered. One that I would like to mention is conversions and goal tracking.
Goals are set up in the Admin section of Google Analytics (at the view level which sits to the right of the property and account levels). Goals basically tell Google Analytics to track a given action in your site. Usually, this will be a specific web page that a user lands on after filling out a contact form, signing up to an email mailing list or completes a purchase.

Goals
Goals can also be a user spending a given time on the site or a page, viewing a certain number of pages per session, or a specific event like playing a video, opening a drop down menu or a rollover animation.
Goals and conversions can be tracked and analysed across many of the reports we’ve mentioned in this guide, allowing you to quickly assess whether certain tactics are working or not. For will all depend on what you want your website to achieve.
It’s easy to get lost in all the data that Google Analytics generates, so it’s important to have a skilled and seasoned SEO consultant to interpret the data and make sense of it. Understanding these metrics and reports at even a base level though, will immediately empower your small business and give you greater insights into the success of your digital marketing strategy.
Business & Finance Articles on Business 2 Community(32)