
What we’re looking for is to also answer the question “how to see which pages/posts receive the most traffic”. A little bit like finding popular landing pages.
E.g.: you have a site with 1000 pages that link liberally to each other in their content. Now which of these pages receive the most internal traffic?
Better yet: if page A gets the most internal traffic, from which internal pages does it get that that traffic?
This is the website that you built.
These are the pages that lived on the website that you built.
This is the traffic that came to the pages
That lived on the website that you built.
This is the question that reviews the traffic
That came to the pages
That lived on the website that you built.
The question is, “Which pages receive the most internal traffic and from where?”
Knowing the answer will help evaluate and improve internal linking practices through analyzing facts and user behavior.
Tracking Internal Traffic
One of the ways to find information on internal traffic in Google Analytics is to look at User Flow. Go to Audience > Users Flow. Select Landing Page in the dimension settings.
![]()
You will see paths users take through your website. First, second, and other interactions would be pages getting internal traffic. Unfortunately, this view does not provide aggregated data about all internal traffic to each page.
For more comprehensive information, go to Behavior -> Site Content -> All Pages and click on Navigation Summary page. Each page you select will have previous page and next page information. This particular view includes data on traffic (pageviews).

Still, this standard report might still be limited for you. A better way is to create a custom report.
A Custom Report To Show Internal Site Traffic
Custom reports in Google Analytics give you a lot of flexibility. They are very easy to create. Go to Customization in Google Analytics and click on New Custom Report button (top left).
Add metrics for the website pages. For example, pageviews, average time on page, % of exits, page value, page load time, etc. Be careful not to add metrics that apply to sessions (e.g., time on site, goal completions, goal value, etc.) Learn more about session and hit metrics.
Add Page and Previous Page Path dimensions. Filter out referring pages that are not internal – include Previous Page Path that matches regular expression: the path starts with slash and has characters after. This filter removes landing pages from the results. Save the report.

Using this report, you can also drill down which pages are bringing traffic to each page. Click on the Page URL in the report and you see the list of URLs linking to the page and how much traffic they brought. Nifty, huh? But do not stop here. Let’s get even better insights.
Export this report to Excel. On the report page, go to the bottom of the page and expand the table to show as many rows as you need. At the top of the page, select csv or Excel (XLSX) from Export menu. If you select csv, all your data will be delivered in one file. With Excel option, you will get a file with 3 tabs: Summary, Datasheet 1 (the one you will be using), and Datasheet 2. Leave only Datasheet 1. I named mine “Internal Traffic.”
Clean up the Analytics data. By default, Google Analytics omits your domain name. Screaming Frog does not. In order to match the data, I added domain name before the page path in Analytics data.
Data Fusion For Better Analysis
Sometimes Google Analytics does not provide all possible data. It helps to add metrics from other resources to make the insights more comprehensive. For example, use Screaming Frog to generate link data from your website.
Use Internal tab, HTML filter and select Export -> All Links. As a result, you will get a csv file. You can also export specific URLs page by page.

In the exported csv file, you will get all links, including JavaScript, images, etc. Filter out any link type that is not HREF. Make sure all your Source and Destination data starts with your domain name by deleting any URLs that are not internal. You can use Excel data filter.
Create a pivot table to find out how many internal links each page has. Put Destination in rows and Count of Source in Values. Now you have count numbers of links pointing to pages. You can make the report more detailed. For example, add Anchor in Rows to check anchor text diversity. For the purpose of this analysis, I am sticking with just the number of links.

It is usually tricky to work with data that remains in pivot tables. For simplicity, copy the data and paste it as values in a new sheet. I named mine “Links.”
Add “# of links” column to Internal Traffic sheet. We are going to combine link data with Google Analytics data. Enter the formula below:
=IFERROR(VLOOKUP([@Page],links[#All],2,0),0)

Here is the formula breakdown. VLOOKUP: take the URL from Page column, compare it to the first column in links sheet and get the value of the second column (number of links) if there is an exact match. I added IFERROR function to display zero if there are no matches.
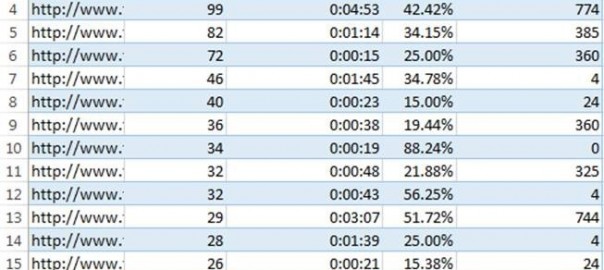
Insights
The results are interesting. The first page (A2) is a blog post, which has few internal links, but gets a lot of pageviews from those links. It also has a high exit rate. Should I consider putting a call to action on this page?
My third page (A4) is a major conversion page. It has a lot of links, but not very many pageviews. Time on page is ok, but exits are high. I need to make the page more compelling for people to go through the conversion. This page is a candidate for conversion optimization.
Finally, the page in A8 is a product page with very low time on page and exits. Feels like people passing through. The page is definitely not sticky; perhaps, not relevant to the user flow. I would look at the pages that send traffic to the page and where people are going to after. Navigation summary should help with that.
Armed with data, it is now possible to spring into action.
What do you usually learn from your internal traffic? What is your internal linking strategy?
Now Read:
- 9 Google Analytics Advanced Segments You Can’t Live Without
- Google Analytics Insights For Content Creators
- How To Use Landing Pages In Google Analytics To Find Keywords
Next Steps:
- 9 Google Analytics Advanced Segments You Can’t Live Without
- Google Analytics Insights For Content Creators
- How To Use Landing Pages In Google Analytics To Find Keywords
Hand-Picked Related Articles:
- 9 Google Analytics Advanced Segments You Can’t Live Without
- Google Analytics Insights For Content Creators
- How To Use Landing Pages In Google Analytics To Find Keywords
* Lead image adapted from Pat Dalton…
Which Pages Receive The Most Internal Traffic [Google Analytics]
The post Which Pages Receive The Most Internal Traffic [Google Analytics] appeared first on Search Engine People Blog.
(77)


