— June 29, 2018
What does the Kanban Guide for Scrum Teams (at https://www.scrum.org/resources/kanban-guide-scrum-teams) say about work in progress limits?
“Kanban (n): a strategy for optimizing the flow of stakeholder value through a process that uses a visual, work-in-progress limited pull system.
….. Optimizing flow requires defining what flow means in a Scrum context. Each Scrum Team must create its definition of “Workflow” containing the following elements:
……. workflow must contain a definition of how Work in Progress (WIP) will be limited.
……Limiting WIP Work in Progress (WIP) refers to the work items the Scrum Team has started but has not yet finished. Scrum Teams using Kanban must explicitly control these in-progress work items from the time they consider them “started” until the time they consider them “finished.” That control is usually represented as a number or numbers on a Kanban board. Those numbers are called “WIP Limits.” A WIP Limit can include work items in a single column, several grouped columns, or a whole board. Once the Scrum Team has established a WIP Limit, it refrains from pulling more than that number of work items into a given part of the workflow. The Scrum Team controls what the limits are and how it will apply them. The primary side effect of limiting WIP is that it creates a “pull system.” It is called a pull system because the Scrum Team starts work on an item (i.e. pulls) only when there is a clear signal that it is time to do so (note this is different from a “push” system, which demands that work start on an item whenever it is requested). When the WIP drops below a defined limit, that is the signal to start new work.
The Sprint is itself a form of limiting WIP. By definition, a Sprint is a way of controlling how much work a Development Team is going to attempt during a specified period. Work is only pulled into a Sprint Backlog when the Development Team chooses to do so (usually, but not always, during Sprint Planning). Whether intended or not, Scrum has embraced this fundamental practice of flow from its beginning. Kanban’s more granular and explicit WIP Limit not only helps workflow but can improve the Scrum Team’s focus, commitment, and collaboration even further”.
You might be not so advanced with your Scrum with Kanban. Perhaps, you only visualize your work and your team doesn’t bother with WiP limits. Visualization is useful as long as it is fresh, in that one receives signals from a well-designed board about where the flow of the delivery of value is getting impeded.
The four basic metrics of flow that Scrum Teams using Kanban will need to track are as follows:
• Work in Progress (WIP): The number of work items started but not finished (according to the Scrum Team’s definition of “Workflow” in The Kanban Guide for Scrum Teams).
• Cycle Time: The amount of elapsed time between when a work item “starts” and when a work item “finishes.”
• Work Item Age: The amount of elapsed time between when a work item “started” and the current time.
• Throughput: The number of work items “finished” per unit of time. Note the measurement of throughput is the exact count of work items.
Calculating cycle times and work item age requires the Scrum Team to (at a minimum) track the start date and finished date of each item. All the graphs in this post were made possible simply by collecting start & end dates.
These metrics should be monitored throughout the Sprint – specifically in the Scrum Events (see the Flow-Based Events section below). As always, there are other flow metrics that the Scrum Team may want to examine, but these are the minimum requirement.
Whilst the Sprint itself limits WiP, the addition of WiP limits drives a dramatic improvement in the performance of Scrum teams. One caveat is that better results get attained if work in progress is not allowed to age. Another caveat is that setting too low a WiP limit is something to watch, by monitoring statistical performance as well as “how it feels”; having too low a WiP limit is rarely an issue for knowledge work though. Why does limiting WiP reduce cycle time? Because cycle time reduces when “wait time” and “task switching” time are squeezed out, driving has a better correlation between cycle time and estimated effort. We begin to realize that maybe estimation is not needed, as completing items means more (let’s cover that in another post).
 – Don’t Just Limit WIP – Optimize It!")
There are examples that go to 30 days cycle time for 2-3 days of work from London, UK and Hilversum, NL, and at this point, the response is usually “if only we had more team members”. The only intervention we make is to apply WiP limits that create realistic tension to collaborate to finish work. This is because of Little’s Law, proven in 1961 and revisited 50 years later, and still true today.
Little’s Law, when stated in terms of departures instead of arrivals, requires some assumptions (see Daniel Vacanti’s video at https://vimeo.com/52683659).
 – Don’t Just Limit WIP – Optimize It!")
Little’s Law when stated in terms of departures (note underlying assumptions in Daniel’s video). Lead Time = End to End Customer Cycle Time or Selected to Done for out simulations)
In this video (which I cannot recommend highly enough along with his Titanic video at https://vimeo.com/239539858), Daniel refers to Little’s Flaw, that is assuming Little’s Law will work when the underlying assumptions to make it work are not satisfied. The primary assumption to my mind is not allowing aging of work in progress. That is, once it starts you should aim to finish the item as soon as possible without aging more than other items in progress.
Teams eliminated Little’s Flaw by having explicit policies in their workflow including watching/preventing the aging of work in progress. These “Little’s Flaw killer-policies” allowed Little’s Law came fully into effect. Our teams became much more predictable, even with very complicated work, with dependencies, and (shock horror:)) ordering features with cost of delay (features are Product Backlog Item bundles in this case). The trick to avoid aging, is regardless of how the Product Backlog Items (PBIs) were ordered, once they get selected (customer commitment) we should finish them as quickly as possible.
 – Don’t Just Limit WIP – Optimize It!")
Cumulative Flow Diagram(CFD) shows the amount of work arriving, at various stages of in progress, and done. This CFD is for a team in Cincinnati, from one of 90 or so simulations that pretty much went the same way, although this team was quicker to optimize than most others. Sprint length was 6 days. Notice the batch replenishment every few days, ok as long as the Sprint Goal is not compromised, although smoother replenishment would be better. The slope of top blue line is average arrival rate into “selected” (sprint backlog). Slope of top red line is average arrival rate into “build”. Slope of top green line is average departure rate, not totally in line with arrival rate. I was happier that slope of top red line was towards the end roughly tracking the slope of the top green line from day 13 onwards, indicating a movement to “stop starting and start finishing”behavior.
 – Don’t Just Limit WIP – Optimize It!")
Cycle Time Scatter Plot for Product Backlog Items – this is the usual pattern – notice the dramatic improvement in cycle time predictability. We can see evidence of flow debt (metaphorically borrowing work time from Peter to pay Paul sacrificing Peter’s cycle time) earlier in the chart, debt which was repaid by longer cycle times later. It takes a number of “days” to bleed a clogged system before cycle times find a new norm. This was a better example than most simulations, with less work-in-progress to bleed than usual.
 – Don’t Just Limit WIP – Optimize It!")
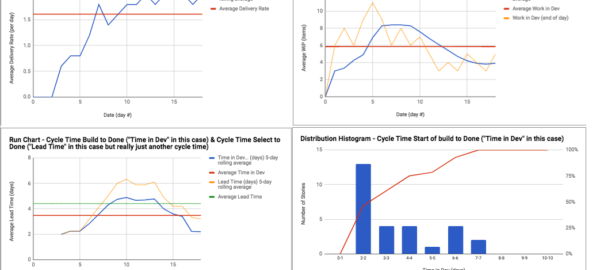
Notice the typical pattern for these Featureban simulations – initial honeymoon period without historical work causing distractions, team still ends up backing up with an excessive amount started (and often impeded) work, after WiP goes down, cycle times reduce, and then a lag to improved delivery rate (would have continued to increase in this case to 3 to 4 per day if I had let the simulation continue like in previous simulations). Notice also the tightening of cycle time around 2 days on the distribution histogram. Monte Carlo using random number ranges from this simulation would have produced good results as at least one item was delivered per measured time period (days). A blog post on Monte Carlo will come later.
I used Mike Burrows’ Featureban (https://www.agendashift.com/featureban) and Andy Carmichael’s additional design, with some tuning. “Daily”, team members flipped coins. Heads or Tails, heads was a good day, tails not so good, and people learned to benefit from one of the rules for tails that one could move an item from selected into build. On a given day a PBI could move into selected and build with heads or tails, and then with two heads, could move through Build and Test into Done. In this case, we know that each PBI takes two to three days if there is no waiting. We seemed to get reliable with 2 day cycle time towards the end and it seemed pointless to continue as it was obvious from that point we would stay consistent as long as we did not change policies.
There were about 90 advanced Featureban simulations in the US and across the EU, and the evidence is clear (within the constraints of this series of experiments). A limit of 6 work in progress items for say 9 developers leads to more collaboration. I noticed that a WiP limit of 2/3 to 3/4 of the number of development team members was the “sweet spot”. When work in progress was not allowed to age by consciously selecting the oldest-in-progress item first (or even for example “if any item is older than 4 days let’s move it”), the dramatic reduction in cycle time was causal, not just correlated. When WiP limits created more pull, teams focused on the rightmost part of the Kanban board first so pull signals would come from right to left, with no work getting pushed into the 1st in process column (Build) until the team is ready.
I had a team once who removed the WiP limits at this point and immediately cycle times increased in an identical trend to before. I had only a few teams with “fake WiP limits”, limits that were so high they were not creating tension to finish work, and those teams had the same trends as push systems, cycle times that were getting longer and longer.

Some teams understood that a really frugal Product Owner can appear to avoid the need for teams to have the discipline to limit their own WiP. You can see that even in this case in Cincinnati with frugal under-commitment that cycle times still got longer and longer. I saw only one case (in Leeds, UK) where the product owner was so mean with the work that the Development Team did not see the need for WiP limits (and the need for that discipline seemed to have been taken care of by the Product Owner only dropping work in when she was confident the team would move it into build that day). However, there are a couple of issues with this:
- The Development Team is not self-managing in that it is not selecting work in consultation with the Product Owner, to support the Sprint Goal negotiated between the Product Owner and the Development Team. That is the Product Owner is acting more like Project Manager 2.0, and there is no project manager role in Scrum.
- It is more like just-in-time replenishment to the extent that the Development Team might have come up with a better suggested order of PBIs for the Product Owner, particularly in a multiple teams Scrum scenario. Refer to Barry Overeem’s post Myth 5 – In Scrum, the Product Backlog is prioritized (http://www.barryovereem.com/myth-5-in-scrum-the-product-backlog-is-prioritized/). The Development Team’s ability to decide how to do the work where there are dependencies, or the need to acquire more knowledge/skills first, is impeded somewhat.
In post 2 of this 3 part series, we’ll cover PSK with complicated work and complex work. In post 3 of 3, we’ll talk about Toyota Improvement & Coaching Kata for flow-based retrospectives.
Meanwhile, check out Daniel Vacanti’s case study for Kanban at Siemens Health Services at https://www.infoq.com/articles/kanban-siemens-health-services, where reduction of end to end customer cycle time for complex work was validated.
You will miss a trick if you do not optimize to flow of work via WiP limits. Don’t be fooled by temporarily rising throughput without WiP limits. WiP is a leading indicator of cycle time. Cycle time can be a leading indicator for throughput but there can also be a tradeoff between cycle time and throughput. For example, when you deliberately incur “flow debt” (borrowing work time from other items to prioritize an item(s) in progress, thus causing relative ageing and disruption the assumptions for Little’s Law – see Daniel Vacanti’s Little Flaw video at https://vimeo.com/52683659).
Another tradeoff example that Andy Carmichael gave me is when a system is overburdened reducing WIP increases throughput (by reducing overhead tasks and failure demand) and reduces cycle time. When a system is underutilized reducing WIP will *reduce* throughput but have no effect on cycle time. In between, there’s a choice to keep cycle time low by reducing WIP, or allow a higher WIP so processes are not starved of work. In theory, this should increase throughput.
Visualize your work for sure, but go the extra mile to optimize the flow of value. It leads to a calmer and most sustainable work environment, and I’d be surprised if it doesn’t improve quality. Don’t under-estimate Professional Scrum with Kanban, it adds horsepower to your Professional Scrum.
Business & Finance Articles on Business 2 Community
(124)