— February 6, 2018
Visual content is processed 60,000 times faster than text. Using infographics in your marketing can help you better engage and capture reader attention.
But here’s the thing:
Infographics aren’t just great for grabbing a reader’s attention.
- They get shares, which helps you reach and engage a new audience.
- They rank for keywords, allowing you to fill difficult search ranking placements with engaging content.
- They get backlinks. People love to link to assets that capture complex or interesting topics in a simple visual format.
- The can generate leads. Leveraging interactive elements allows marketers to capture lead information directly within the infographic.
Infographics give marketers the quadruple threat.
But it’s not enough to spend hours researching and crafting the perfect infographic. You need a strategy, and enough follow-through to get your ideal audience to actually see it, and take action.
In this post, I’m going to explain how you can ramp up your infographic marketing strategy to get more traffic, shares, backlinks, engagement…and leads.
But first, check out some successful infographic marketing campaigns for some inspiration.
Successful Infographic Marketing Examples
Infographics are a secret weapon you can use to get tens of thousands of social shares and loads of high-value links from authority websites.
Here are three awesome examples that knocked it out of the park.
Toggl: Software Development Methods Explained With Cars

This infographic targeted development teams — an audience that could be future Toggl customers. Its funny, irreverent style and cartoonish design landed it over 30,000 social shares.
Results:
- 36,100 shares
- 353 backlinks
- 1,000 keywords (including a first page slot for “software development methods”, their target keyword)
Kissmetrics: How Loading Time Affects Your Bottom Line

This infographic ranks for 3,000+ keywords, including the competitive search term “loading time”. This keyword targets a perfect prospect: a concerned website owner, looking to improve their site.
Results:
- 6,300 shares
- 26,800 backlinks
- 3,300 keywords
Copyblogger: 15 Grammar Goofs That Make You Look Silly

This educational infographic tapped into two of the internet’s biggest fears: making grammar mistakes, and looking silly. It ranks on the first page for “common grammatical errors”, which gets over 4,000 monthly organic searches.
Results:
- 254,900 shares
- 6,000 backlinks
- 3,200 keywords
A Data-Driven Look at Why Infographics are Still Crushing It for B2B Marketers
Infographics weren’t just a big thing in the early 2010s, they were the next big thing. And, marketers went absolutely nuts over them.
Infographics tap into an evolutionary human trait – brains process graphical information much easier, and faster.
Science aside, let’s look at some hard data to back this up:
41.5% of Marketers Say Infographics are the Most Engaging Type of Visual Content
A 2017 study by Venngage revealed 41.5% of marketers report infographics are the most engaging visuals they produce.
Ahead of videos, charts, and gifs…

37% of Marketers Think Visual Content is the Most Important — More Important than Blogging
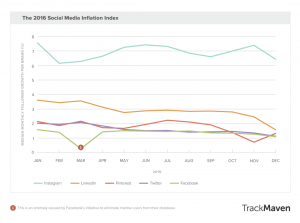
The 2016 Social Media Examiner Industry Report shows us that marketers put great importance on visual content.
37% of marketers believe visual content is more important than blogging, which proves the effectiveness of their results.

Infographics are Liked and Shared on Social Media 300% More Than Any Other Type of Content
NNGroup states that visual content — infographics in particular — does exceptionally well on social media, getting 300% more likes and shares than other kinds of content. The same study also emphasized the importance of combining images and information to improve user experience:
“The commonality across all of these examples (and thousands more in our other studies) is that users pay attention to information-carrying images that show content that’s relevant to the task at hand. And users ignore purely decorative images that don’t add real content to the page. So much fluff — of which there’s too much already on the web.”
BUT:
Infographics are only as powerful as the foundation they are built on…
A Simple 4-Step Framework for Creating a High-Performing Infographic
You can burn money churning out infographics on any random topic, or you could drive meaningful results by nailing the following four things:
- Choose the right topic
- Choose the right facts and stats to tell a compelling story
- Choose the right layout and visual design
- Choose the right interactive elements
Step 1: Choose the Right Topic
It’s not all about the latest trending topics. Driving traffic that doesn’t align with your overarching business objectives won’t benefit the bottom line, it’ll just pump up your vanity metrics.
So, how do you know what the right topic is?
Choose a topic that:
- Hits one of your target keywords (“An in-depth map of the customer journey”)
- Solves a key pain point for your customers (“The anatomy of a perfect blog post”)
- Plays on your audience’s fears and aspirations, invokes awe, happiness, outrage, or humor (“The 7 kinds of terrible SaaS customers” or “How Bad Customer Support is Burning Your Bottom Line”)
The best starting point is keyword research. Keywords help drive demand. The more searches a question gets, the more people want to know the answer.
After you’ve got the right keyword (or question/topic), the rest is positioning.
The first step to finding the right topic/keywords is opening up your keyword research tool of choice. In this example, I’m going to use Ahrefs, and the example of a fictional web design agency.
Let’s say I’m looking to attract businesses in the early stages of the funnel; users that want to design a website, but can’t. A common way to build a website — and a necessary first step — is to use HTML.
So, how about we target folks looking to learn HTML?

An infographic targeting “HTML basics” also isn’t just something you read once and forget about. It could be a resource the learner constantly refers back to.
Check out SEO 1 Click’s infographic for an example of an infographic that helps prospects solve a pain point, targets a keyword, and plays to the reader’s aspirations.
Step 2: Choose the Right Facts and Stats to Tell a Compelling Story
You can get huge lists of statistics for any topic by running some basic Google searches:

Unless you’re in a really niche area, there’s no shortage of data. And, if there is, have a go at gathering some data yourself, like Process Street did in this post and infographic about SaaS pricing pages.
You’ve got to handpick the right stats to tell your story and make your point.
To do this, you can pick a proven structure to get started:
- Data-driven: uses data to tell a story, sometimes starting out by illustrating the prevalence of a particular trend (eg: mobile phone usage) and building up to talk specifics that relate to the infographic’s purpose (marketing SMS open rate).
- Problem/solution: poses a problem to tell a story, and then uses data to prove the effectiveness of a solution. This is a good structure to use to add a human element or narrative to an infographic, like this example below.
Step 3: Choose the Right Layout and Visual Design
You can have the best data in the world, but a poor layout will have readers bouncing from your page page at sonic speed. This is something you’ve really got to nail, but don’t worry — like a lot of content, it’s best to stick to proven methods.
Now’s a good time to draw from an infographic by Piktochart’s SeeMei Chow:

You see infographics using the six templates above all the time — they’re clear, and make it easy for the reader to make sense of the information. You can use an in-house designer, hire a freelancer, or use an infographic maker.
Step 4: Choose the Right Interactive Elements
Interactive infographics like this one help marketers better engage their audience, and stand out from the crowd. The interactivity takes the content’s narrative to a whole new level, and encourages readers to participate and provide their own information (which you can use to later market to them).
More than half of buyers are influenced by custom content:

Add interactive elements like questions, animations, calculators, or hidden content to your infographic. Interactivity takes infographics to a whole new level — they can turn a one-way monolgue into a two-way dialogue.

This gif is a snippet from the MailChimp 2016 report, an infographic that keeps the reader’s attention with its unique design and animated elements.
Taking it a step further, you can add elements to force readers to actively participate in the content experience by clicking to reveal information and enter details to get personalized results:

This interactive infographic takes input by asking the user to select their areas of focus for winter home maintenance. While clicking through to select areas in the graphic, the user reveals extra information before submitting their selection through a lead generation form.
It’s easy to see how this added layer of interactivity can drive users to take action, not just consume content — interactive content has a 2x higher conversion rate than static content.
Want to see how other B2B companies are using interactive infographics to collect qualified leads? Check out this post for 75 additional examples.
Now it’s time to get some eyeballs on your infographic…
How to Promote Your Infographics
It’s not enough to email your list once, post a quick tweet, and wait for the views to roll in. You’ve got to put in extra effort to make sure your infographic gets the attention, shares, and backlinks it deserves.
The tactics for infographic promotion are a little different to tactics for promoting other content. For infographics, you want to focus on the effectiveness of visuals in social media, and make it easy for other blogs to use your infographic in their site so you can get quality backlinks and drive targeted referral traffic to your site.
Here are some actionable tips for promoting infographics:
Make It Embeddable
At the bottom of infographics, you’ll often see a box like this:

This embed code makes it easier for bloggers to embed a sourced version of the infographic on their site. The sourcing is great for you because it means a backlink, but also easier for the blogger because they don’t have to handle any of the attribution or code.
The box with the embed code is a simple HTML <textarea> element, and the embed code includes a link back to both the post that hosts the infographic and the image file itself. That’s technically two backlinks for Unbounce, which helps them rank the page on Google search results, as well as the infographic itself in Google Images.
You can use this free tool from Siege Media to create embed codes for your graphics.
Pitch it as a Guestographic
If you’ve got an inbox, you’ve probably seen an email that goes something like this:
“I saw you linked back to a post about productivity on your blog, so figured you’d want to link to my post too”.
Sure, sending out thousands of emails like this might get you a few backlinks for your infographic, but there’s a way to do it that is far more effective.
In his post about guestographics, Brian Dean lays out the formula to build high-authority backlinks:
Great Content + Targeted Outreach + Added Value = Links
Let’s assume you’ve already got the great content part down. Next up is targeted outreach.
Your target? Blogs covering your infographic’s topic. These are easy to find in Google:

Every result on the first page here is a great target, but getting that data into a workable format can be a pain. Instead, you could use something like Ahrefs to grab an Excel sheet of the URLs in seconds:

With a list of URLs in hand, you can either manually source the emails and contacts, or use a tool like Hunter.io — the top-rated email finder among SEO experts.
Armed with a list of relevant contacts and a piece of great, linkable content, you need to execute the next step very carefully, because here’s where it could all go wrong.
Remember that terrible outreach email style I told you about earlier? That’s exactly what you don’t want to do.
Ask yourself: why would the recipient actually care about the offer? What’s in it for them? The trick, as outlined by Brian Dean and countless other SEO experts, is a two-part email sequence.
Part one – a short email based on this template:
“Hey [first name],
I was browsing for [topic] content, and found your blog.
I really liked [something specific that you liked about their page].
And, I just put together an infographic on [topic]. I figured you’d be interested in it.
Let me know if you want to check it out.”
Part two – send the infographic and pitch unique content:
Great, here’s a link: [link to infographic]
Also, let me know if you want to post it on your site. I’ll happily send a unique intro over just for you!
Pretty simple, but you get the picture.
You can automate these outreach emails in a tool like BuzzStream or Mailshake.
Repurpose Sections into Social Share Images for Facebook, Twitter, and LinkedIn
The beauty of infographics is that they’re not just one-and-done content. They’re perfect for re-purposing on social media to drive traffic back to the original post and engage your audience.
Simply screenshotting the infographic and writing a quick summary in the tweet or post is enough. Check this out:

Trello’s keyboard shortcuts feature was widely promoted through an infographic guide. The team shared screenshots of the infographic on social media, and had users retweeting graphical versions of a product’s user guide… If that’s not a huge product marketing win, I don’t know what is.
For more data-driven infographics, excerpt compelling data points that will make your audience want to click and share.

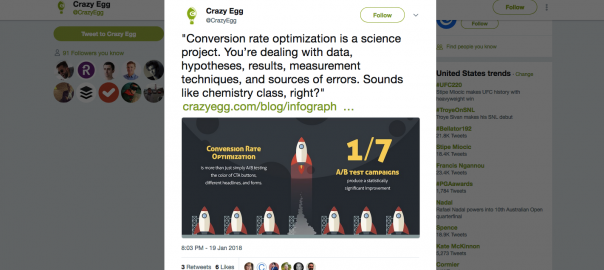
This infographic snippet from Crazy Egg offers an arresting stat, and gets more mileage out of the same piece of content while offering something new to casual Twitter engagers.
Here’s something to try:
Every time you make a new infographic, prepare 8-10 snippets of the key facts and queue up social media posts in a tool like Buffer, Hootsuite, Sprout, Social Jukebox for periodic re-promoting. That’s social promotion on full autopilot, constantly driving traffic back to your infographic.
Use Buzzsumo to Find Influencers Sharing Content Related to Your Infographic Topic
Influencers have the attention of thousands of fans. What if you could leverage their audience to amplify your content and reach a completely new audience?
The thing is, influencers always need to be on the lookout for content their audience will love. It’s a big responsibility. Make it easy for them to find it 🙂
The first step is make a list of influencers who have shared content related to your infographic. BuzzSumo makes this super easy:

Just paste a URL that relates to your infographic, and get a list of influencers who shared it on social. These people are likely to share your infographic, too!
With your list in hand, either in a spreadsheet, Twitter list, or saved inside BuzzSumo, it’s time to start connecting and building relationships.
- Share a piece of their content
- Leave a comment on their blog
- Reach out and let them know you’ve seen they are interested in your infographic’s topic and share your content with them.
This is similar to the guestographic tactic mentioned above, but the aim is to build influencer relationships and get shares instead of backlinks.
Cut Out the Stats and Compile into a Slideshare to Reach B2B Decision Makers
The B2B world is hungry for Slideshares.
According to B2Bmarketing.net, SlideShare receives 500% more traffic from business owners than Facebook, Twitter, YouTube, and LinkedIn. This huge audience combined with native lead capture functionality makes Slideshare a true force for B2B marketing.

(Officevibe are killing it on Slideshare by repurposing infographic content into slideshows — this one got over 85,000 views.)
Once it’s on Slideshare, you can leverage the platform’s connection to LinkedIn:
Embed it in a LinkedIn Pulse article that summarizes the stats, and share it to personal, employee, and company pages.
Want more strategies to promote your infographic?
Here you go:
10 Additional Infographic Promotion Tactics to Try in 2018
- Promote to your existing fans (website visitors, customers and Lookalike Audiences on Facebook).
- Use the quora hack: find high traffic threads relating to your topic, and respond with a helpful answer that includes a link to your infographic.
- Send it to your list (and re-send to non-openers with a different subject line angle).
- Submit it to infographic directories — here’s 20.
- Get it featured on popular Pinterest boards in your niche.
- Export the Twitter handles of people sharing similar infographics or content topics out of Buzzsumo. Upload the lists as a Twitter targeting audience, as explained in this guide.
- Submit your infographic to Quuu Promote to get it suggested to influencers.
- Reach out to the cited sources and let them know you featured them. Ask for help promoting.
- Use BuzzSumo to extract all the people sharing related content in the past. Use Scrape Similar to scrape all the people commenting on related content. Reach out and let them know about your new visual asset on the topic. These folks have already shared your content, and are more likely to do it again.
- Co-create an infographic with an influencer to tap into their audience. Brian Dean and Larry Kim, for example, partnered on a Wordstream infographic on the topic of increasing click-through rates in search engines. The article got a ton of engagement, and now ranks for a bunch of high-traffic keywords.
BONUS: Skyrocket Engagement (and Conversions) by Repurposing Static Content into an Interactive Infographic
While traditional infographics are effective, the internet has become saturated with them. They’re so ubiquitous, people are becoming less responsive to all the noise. It’s important to adapt your tactics in order to maintain a competitive content marketing advantage, and engage readers.
But engagement isn’t the end goal. It’s not enough.
At the end of the day, you want to be capturing more qualified leads for your business.
Enter interactive infographics.
We wrote a huge guide on how to make them here. But, here’s the 10,000ft view:
- Start with ideation and data gathering
- Select a visual theme that fits the story
- User action should create a reaction
- Personalize the content by requiring user input
- Hide content to inspire action and engagement
- Include in-graphic forms to capture information
Is it worth the extra effort to convert static content into interactive experiences?
Yes! But don’t just take our word for it. Check this out:

That’s 36% of marketers that believe static content is effective at converting, versus 70% of marketers who say their interactive content is effective.
Plus, what’s more appealing? A static image like this…

Or an interactive infographic like this?

Not convinced yet?
Here are 8 other interactive content stats that might change your mind 🙂
Ready. Set. Promote.
By now you should have a solid roadmap for building engaging infographics, and getting them in front of more people.
While static infographics are a great content marketing medium, they are becoming less effective every day. If you want to break through the noise and go above social engagement and links, consider adding interactive infographics to the mix. They can be used to capture leads across all stages of the buyer journey.
Check out SnapApp’s interactive infographic toolset here.
Digital & Social Articles on Business 2 Community
(114)