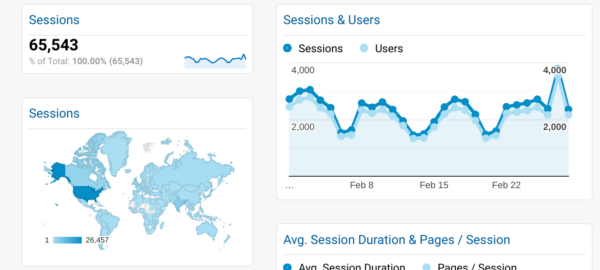
Do you appreciate looking at a dashboard every day? If you are a stakeholder for or work on a web property, we’ll talk about a Google Analytics dashboard that you could check for a minute or two every day. This dashboard functions exactly as it’s supposed to while helping to keep measurement considerations top of mind.
Some people want to create “dashboards” that are 7 pages long. Others would say that is a report. A dashboard provides an overview or key performance indicators, that is the KPIs, at a glance. It’s something you’ll look at for no more than a few minutes as a health check on performance for what you’re working on.
This Google Analytics dashboard format helps you focus on growth and is useful for any size project or business.
Dashboard Structure
A good dashboard structure is based on the ABC’s of web analytics, courtesy of Avinash Kaushik who’s a digital marketing evangelist for Google. A stands for acquisition, which refers to how traffic reached the web property and how much of it there is. B is behavior, which refers to user behavior and how users interact with the web property. C stands for conversions, which tells us the outcomes of the user journey, as in whether they converted or if they left without engaging.
Acquisition
The acquisition section tells us characteristics about the traffic that arrives on the web property. How much traffic there is, how traffic is trending over this time frame, and where it’s coming from as far as the web channels of the traffic sources and the countries of the users.
Behavior
The behavior section tells us whether the traffic is staying around. Use the bounce rate, which is the rate at which users leave the site after viewing the first page without any interaction. If they are staying around, use their average session or visit duration and the number of pages viewed per session. Add data on any actions that they might take while on the web property. Note that seeing data for these events does require adding some customized tracking.
Conversions
The conversion or outcome section tells us how the user journey ends. Are they achieving a desired outcome or goal with the conversion rate–eCommerce conversion rate or other conversion rates if you don’t have an e-commerce component? How goal completions are trending over the time frame, the number of transactions or conversions and the conversion rate broken down by traffic channel, and the number of conversions and conversion rate broken down by device category are good data points to include.
Conclusion
This isn’t a one-size-fits-all solution. These widgets depend on what kind of web property you have and what’s important for you to track. This should still provide you with guidelines on how to configure your overview dashboard.

This article was originally published at Growth Learner and has been republished with permission.
Digital & Social Articles on Business 2 Community
(95)