
Do you keep track of how many visitors you get on your website every day? Do you keep an eye out for what device they’re on, where they’re coming from, or which pages are the most popular ones for people to visit? Are you looking out for which social network generates you the most traffic?
Google Analytics is easy to install, but you have to keep on top of it to get the most out of it. In this guide, we’ll show you how to make the most of it. You’ll be able to tell:
- Who your audience is.
- How they’re finding your site.
- What posts are popular?
- How to get more traffic.
Audience
To find out more about your audience, you can ask your website visitors to fill in a survey, or you can simply look under the audience tab on the Standard Reports on your dashboard.
This will tell you information like where the visitor is, what device they are using to look at your site, and many other bits of useful information.
For example, you can see how many people are viewing your website from a mobile device. If a lot are, and it’s likely to be around 50%, you should really have a responsive site so that they can really see what you’re offering without having to zoom in and out.
To see if your audience is using mobile, look under audience-> mobile-> overview. If you look under devices, you can ever see what device it is that they are using to browse.
How are your visitors finding you?
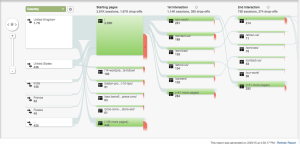
All Traffic and All Referrals are the two tabs that will help you understand where your visitors come from. They’re under the acquisitions section.
All Traffic lets you know how someone found your site, whether through search or straight from their browser by entering your domain name.
All Referrals is more detailed, exploring links from other websites and omitting search traffic.
What posts are getting noticed?
Your All Pages report can be found at behaviour-> site content-> all pages.
This lets you know some key metrics for your site.
Pageviews – This lets you know the total number of visitors you have, including unique page views.
Avg. Time on Page – This lets you know how long people are spending on your page and whether they’re capturing people’s interest or not.
Bounce Rate – If people click on and then quickly off your site, this is known as bouncing. This lets you know how high your bounce rate is. You don’t necessarily need to worry about an overly high bounce rate, but it can be instructive to look at it on a page level. If you’re a blogger for example, your bounce rate might be 90%. Does this mean your articles are terrible? Not necessarily – many visitors could have got what they wanted from the post they landed on and then left. To go further into this you can look at events triggered on scroll, to get feedback on how far through articles visitors get.
Want More Traffic?
You can generate more traffic by understanding your analytics report. If all your traffic is coming from Facebook, you need to spend more time creating content tailored for that audience and that will get more people interested. Likewise, if it’s coming from search, spend some time improving your SEO to get even more traffic this way.
Understanding all your Google Analytics metrics is a long process, but hopefully, we’ve given you a taste to see how it can benefit you.
(265)