— July 13, 2017

TheAndrasBarta / Pixabay
Many travel brands have a poor reputation when it comes to user experience (UX). We’ve all come across those annoying forms, endless checkout processes and questionable mobile experiences while trying to sort out a holiday. And we’ve all given up on brands before making the purchase as a result.
In fact, the SalesCycle Q4 2016 Remarketing Report puts booking abandonment rates at an eye-watering 81.6% for travel brands which is scary when you consider that 76% of all UK travelers booked online in 2016.
Poor user experiences are letting travel consumers down but you don’t need to fall into this trap. Today we’ve got five ways you can use Google Analytics to pinpoint UX issues and put them right.
Step #1: Identify user intent of organic traffic
The first thing you want to do with Google Analytics is identify the user intent of your organic traffic. To do this, you’ll need a Google Webmasters account linked to GA so you can access the Search Console (instructions here).
Once you’ve got this data feeding into Google Analytics, you’ll be able to see which search terms people use before they land on your site. You can use this to determine a number of things:
- Are they looking for something you don’t provide?
- Is the information they need on the pages they visit?
- Is your content ordered to match their priorities?
- Does your content match the language they use?
- Are the right pages ranking for the queries they should be?
As soon as users click through to your site, the brand experience has begun – and this starts by matching their intent with the right message.
Step #2: Create custom reports per device
The consumer journey for travel purchases is one of the most complex around. Mobile accounts for more than half of all travel-related browsing but only 20% of bookings take place on mobile. This is telling when 76% book online and 56% of people who book on mobile say the experience is more frustrating than on desktop.
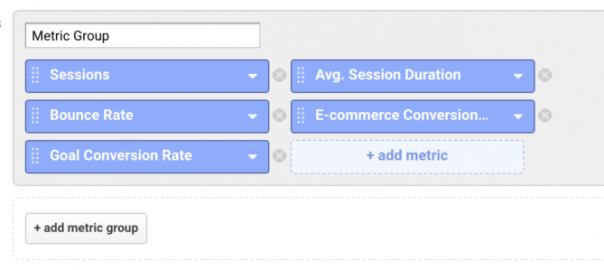
To optimise a single site for these different experiences, you’ll need to create custom reports in Google Analytics for each device type.
To do this, log in to your account and click on the Customisation tab in the right sidebar menu.

Next, click on Custom Reports from the dropdown options and select + New Custom Report. Now you can create custom reports for traffic by device and choose which metrics to collect data from.

Using these reports, you’ll want to pinpoint UX issues unique to each device type. Is your mobile navigation causing problems? Are your form conversion rates worse on mobile or desktop? These are the kind of questions you need to be answering.
Step #3: See where users go with Behaviour Flow reports
With Behaviour Flow reports you can see the journey users take across your website. You can use these to get an overall picture of how effectively your content and navigation moves users closer to the most important pages of your site.

You can also use Behaviour Flow reports to see where users take unexpected turns or come across road blocks. For example, users who search on your site are expected to click through to one of the results, not suddenly visit your contact page or blog. Behaviour Flow reports highlight these kinds of issues, allowing you to investigate the root cause.
Step #4: Use Goal Flow reports to analyse your sales funnels
While Behaviour Flow reports give you an overview of your entire site, Goal Flow reports focus on your sales funnel to help you analyse their performance. They tell you how effectively you’re steering traffic along the buying process, where users are running into problems and where they’re dropping off completely.
Before you can run Goal Flow reports, though, you’ll need to create a goal for every conversion along your sales funnels.
First, you have your macro goals, the primary conversions like bookings. But you also have micro goals, which are the conversions/actions users take along the consumer journey.
Here are some examples of micro goals for a hotel booking site:
- Creating an account
- Search for rooms
- Viewing a room
- Looking at images
- Saving to favourites
- Clicking the book button (they haven’t paid yet)
- Proceeding to checkout
- Signing up to price/availability alerts
With your goals defined, you can now use Goal Flow reports to analyse your sales funnels. There are various things you can look out for with these reports:
- Where users enter the sales funnel – at the beginning or somewhere along the way.
- Where users deviate from your funnels or drop off entirely
- Pinpoint specific pages that are problematic (eg: checkout pages)
- Gain insights into how effectively your content guides users
- See which funnels perform better than others
- Identify which traffic segments are/are not following your sales funnels
- Diagnose unusual behaviour from users
Let’s say your Goal Flow reports show a number of users click backwards and forwards between the same two pages multiple times. This tells you users are either confused or can’t take the action they want to. Either way, you can now investigate the issue and work towards putting it right.
Step #5: Pinpoint hidden problems with Event Tracking
Flow reports are great at telling you on which pages users run into problems, but there are plenty of interactions users can take that don’t involve visiting a new page. In order to get insights into these actions, you need to set up Event Tracking in Google Analytics.
With Events Tracking you can move beyond saying user x dropped off at page y and diagnose specific UX issues that are stopping people from converting. For example, Goal Flow reports will tell you how many users fail to make it past your account signup page, but they won’t tell you why.
By setting up the right events reports, you can see how many users start filling out your form, how many fail to complete it and even which fields cause most people to give up. With these insights, you can remove problematic fields and optimise your forms down to the smallest details to reduce friction.
With these five Google Analytics techniques, you can gain a wide range of insights into the experience of your users – and this is only the start. GA might not be the most straightforward analytics tool around but it’s still one of the most powerful. Not to mention it’s (mostly) free. Everything we’ve looked at today can be done with a regular account and you can go much further before paying a thing.
Digital & Social Articles on Business 2 Community
(50)