As Wallis Simpson, Dutchess of Windsor, famously said, “You can never be too rich or too thin. Or have too many social media marketing statistics.”
Well, she actually only said the first part (which is debatable), but certainly would have said the second part (which isn’t) had social media been around in the 1930s.
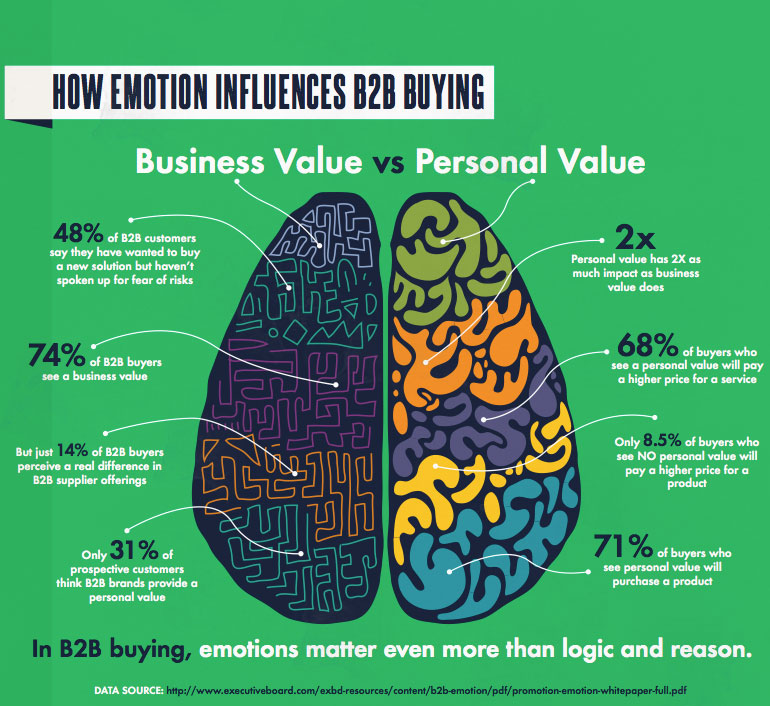
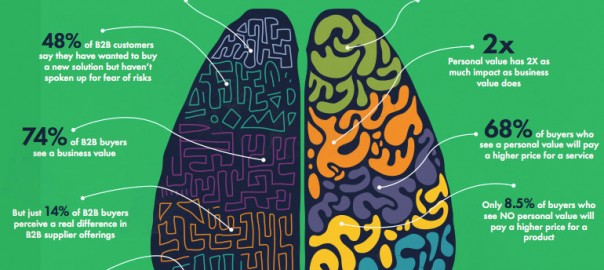
Image credit: Business 2 Community
How effective is social media in comparison to other digital marketing channels? Do consumers actually listen to brands? Do brands actually listen to consumers? How does B2B social media marketing differ in effectiveness from B2C use? Which network drives half of all social traffic to B2B websites and blogs?
What type of posts generate the most engagement on Facebook? What do 91% of consumers check daily? What do more than half of marketers identify as their most critical areas of focus over the next 12 months?
Find the answers to those questions and many more here in 106 digital marketing facts (well, mostly) and statistics from two dozen sources.
21 Social Media Statistics
1. 54% of B2B marketers said they have generated leads from social media. (CMO)
2. Among the largest social media sites, YouTube drives the most highly engaged website traffic (with visitors overall spending on average nearly four minutes and visiting three pages on target sites), followed in order by Google+, LinkedIn and Twitter. Reddit and StumbleUpon drive the least engaged visitors. (VentureBeat)
3. Is the value of social media marketing for b2c brand overrated? 68% of U.S. consumers say they “mostly” or “always” ignore brand posts on every social network. And 83% of consumers say they have had a “bad experience with social media marketing.” (Experience: The Blog)
4. Brand ads on social networks were among the least trusted form of advertising, significantly lower than trust in ads viewed in traditional media. (Experience: The Blog)
5. Among “prestige” consumer brands, over the past four years, less than 0.25% of new customers were acquired through Facebook and less than .01% from Twitter; this compares to almost 10% for paid search and 7% for email marketing. (Experience: The Blog)
6. And yet – 80% of brands advertised on social media sites in 2014. (DashBurst)
7. But – social media can be effective for selling things to marketers. Marketing professionals are 50% more likely than consumers in general to like a brand on Facebook, 400% more likely to follow brands on Twitter, 100% more likely to make a purchase as a result of seeing something on Facebook, and 150% more likely to have completed a purchase as a result of a tweet. (Experience: The Blog)
8. Only 20% of CMOs use social networks to engage and collaborate with customers. (MarketingLand)
9. But 24% of brand say they do “social listening.” (DashBurst)
10. Just 18% of consumers trust posts by brands or companies on social sites like Facebook and Twitter. (MediaPost)
11. While 78% of companies now have a dedicated social media team, only 26% integrate social media fully into their business strategies. (DashBurst)
12. Yet 93% of shoppers’ buying decisions are influenced by social media- because 90% trust peer recommendations. But only 14% trust advertisements. (#Socialnomics 2014)
13. 82% of hyper growth SMBs say social media is effective for generating new leads. (Business 2 Community)
14. 58% of marketers indicate that their social media efforts have generated leads. (Believable.) Social media produces almost double the marketing leads of trade shows, telemarketing, direct mail, or PPC. (Not as believable.) (Business 2 Community)
15. You’ve likely seen the statistic that if Facebook were a country, it would be the third-most populous on earth. What you may not know is that WhatsApp would be #5 (followed by the U.S.), Google+ #7, LinkedIn #9, and Twitter the 10th largest country. (#Socialnomics 2014)
16. For online merchants, the average order value influenced by social media last year was $ 143.46. (AddShoppers)
17. Though 60% of people say they get their news from TV and 29% from newspapers, social media comes in third as a news source at 28%. It’s followed by radio at 19% and other print media at 6%. (Digital Information World)
18. Though most customer service requests (40%) still come through call centers, 18% now originate via email and 13% through “eService” (web, social and chat). Customer service requests through that eService channel are expected to grow 53% in the coming year. (Bluewolf)
19. 90% of enterprises say they use social media to respond to customer service inquiries–yet 58% of consumers who have tweeted about a bad experience never received a response from the offending company. (Bluewolf)
20. When they do respond, the average response time of brands on Twitter to user comments or complaints is nine hours. (Social Media Slant)
21. 75 of the top 100 brands have a presence on Google+. (Social Media Slant)
5 Digital Marketing Statistics
22. For the first time, marketers spent more to advertise on the Internet (a total of $ 42.8 billion) than they did for broadcast television in 2013. (MediaPost)
23. U.S. marketers spent $ 12.8 billion on online display (banner) advertising in 2013–30% of the total online advertising spend. Retailers are the biggest spenders on display ads, accounting for 21% of total spending. (MediaPost)
24. However–just 32% of consumers say they trust online advertising of any type. Consumers trusted the messages in text message ads the least at 12%. (MediaPost)
25. 81% of marketing professionals believe that digital marketing technologies will cause their role to change within the next three years, but just 14% know how to “reinvent” themselves. (FierceCMO)
26. 76% of marketers say they need to be more data-focused to succeed, and 74% agree that “capturing and applying data to inform and drive marketing activities is the new reality.” Yet only 39% report using customer data and behavior patterns to shape marketing strategy in the past year. (FierceCMO)
8 Content Marketing Statistics
27. Marketers identified content marketing and social media engagement (each at 36%) among their top three digital marketing priorities for 2014. 31% included conversion rate optimization. Just 9% placed video marketing, and 2% connected TV, in their top priorities. (B2B Marketing Insider)
28. Consumer marketing is about mobile, B2B is about content. Asked what their organization’s “single most exciting opportunity” was for 2014, 22% of consumer marketers cited mobile, while just 10% of B2B marketers concurred. However, 24% of B2B marketers identified content marketing as their most exciting opportunity, compared to just 11% of B2C counterparts. (B2B Marketing Insider)
29. B2B purchasing decisions in general are taking longer and involving more people on the buying team. 58% of buyers say they spend more time researching than in the past; 53% rely more on peer recommendations; and 65% said the winning vendor’s content had a significant impact. (Marketing Interactions)
30. 88% of business buyers say online content plays a major to moderate role in vendor selection, yet just 9% of respondents think of vendors as trusted sources of content (ouch!); the most influential types of content across both the awareness and evaluation phases of the buying journey are third-party validated research reports and studies. (MediaPost)
31. 68% of business buyers start their content sourcing at search engines and portals, 40% go to vendor websites (why, if only 9% trust them? Hmm…), and 25% are activated by an email from a trusted source or peer. (MediaPost)
32. The three most sought-after types of content by business buyers are comprehensive industry/category surveys and studies (52%); technical details about products and solutions (44%); and analyst reviews or recommendations (43%). (MediaPost)
33. Content plays a pivotal role in add-on buying decisions or supplemental purchases following an initial contract; 86% of B2B buyers frequently or sometimes use digital content to identify complementary or add-on products. (MediaPost)
34. B2B marketers spent an estimated $ 16.6 billion in 2014 on digital content publishing to acquire business leads, influence customer specifications, and educate and engage prospects. (MediaPost)
22 B2B Marketing Statistics
35. LinkedIn is the only platform the majority (62%) of B2B marketers consider to be effective; in second place is Twitter, with 50% of saying it is effective. (CMO)
36. Only 16 percent of B2B consumers prefer live webinars. (CMO)
37. The average B2B marketing budget is about 2% of revenue. (CMO)
38. Metrics matter. 88% of B2B CMOs say their C-suite peers turn to them for data and insight needed to strategize and plan, and 78% agree that marketing’s influence on corporate strategy is greater today than it was just two years ago. (CMO)
39. The highest paying marketing jobs are in B2B. (CMO)
40. 60% of all social media traffic to business to business websites come from Facebook, Twitter, and LinkedIn. (SteamFeed)
41. 34% of tech companies have reduced their traditional advertising budget to fund digital marketing activities. (Only 34%?) (SteamFeed)
42. Just 6% of b2b buyers say that a prospective vendor’s social media activity has “a lot” of impact on their purchase decisions. 30% say it is “important but not a deal breaker.” (Content Marketing Institute)
43. On the other hand, 55% of buyers will eliminate a vendor from consideration if contact information and a phone number are not easy to find on the vendor’s website. (Content Marketing Institute)
44. The vast majority of buyers prefer to contact vendors through email (81 percent) or phone (58 percent). Just 17% want to use live chat and 9% social media. (Content Marketing Institute)
45. After visiting the home page and products/services pages, the most important next stop for b2b buyer’s is a prospective vendor’s “About Us” page. (Content Marketing Institute)
46. U.S. B2B marketers are projected to spend more than $ 100 billion on social media advertising by 2017. (Gerardo Lara on Pinterest)
47. The top social networks and social media tactics used by B2B marketers are LinkedIn and Facebook (each used by 86% of marketers), followed by Twitter (81%), blogging (64%), annd YouTube (53%). At the other end of the spectrum, less than 10% use Foursquare, podcasting, or Quora. (Gerardo Lara on Pinterest)
48. More than 80% of B2B marketers say their top goal in social media is increased brand awareness. (Gerardo Lara on Pinterest)
49. 53% of B2B Fortune 500 companies use marketing automation. (Marketing Interactions)
50. 63% of industrial supplies buyers say they purchase online, making it the most popular purchasing channel. Paper catalogs are least important. (Internet Retailer)
51. 54% of B2B buyers say they spend half or more of the industrial supply budgets online, and 39% say they plan to increase the amount they spend online in the coming year. (Internet Retailer)
52. 67% of industrial buyers say it is “very” or “extremely” important for suppliers to offer the ability to purchase on their websites. Just 7% say this is “not important.” (Internet Retailer)
53. Emotion plays a surprisingly large role in B2B purchases. Even when buyers see the value to the business, only 14% perceive a real difference in supplier offerings. (Business 2 Community)
54. But 71% of B2B buyers who see a personal value will buy a product. (Business 2 Community)
55. And 68% of buyers who see a personal value will pay a higher price for business product or service–but just 8% of buyers who see no personal value will pay the higher price. (Business 2 Community)
56. More than two-thirds of tech B2B searches occur outside of North America. (Social Media Slant)
6 Twitter Statistics
57. “Twitter users who see tweets from B2B tech brands are more likely to visit the sites of these brands. A recent study found that Twitter users visit B2B tech brand sites at a higher rate (59%) compared to average Internet users (40%), illustrating the strong presence of a B2B audience on Twitter. (CMO)
58. There is 50% crossover of members on Instagram and Twitter. (SteamFeed)
59. Tweets with 1-2 hashtags get 21% higher average engagement than those with none; but tweets with more than 3 hashtags get 17% less engagement. (SteamFeed)
60. Grandparents are the fastest-growing demographic on Twitter. (#Socialnomics 2014)
61. Twitter has 255 million monthly active users. (Social Media Slant)
62. 53% of Twitter users recommend products in their tweets at some time. (Social Media Slant)
7 LinkedIn Statistics
63. 83% of B2B marketers use LinkedIn for distributing content. (Gerardo Lara on Pinterest)
64. For B2B websites and blogs, 90% of social traffic is driven by the big three networks–with half of it coming from LinkedIn. (Business 2 Community)
65. 83% of business-to-business marketers use LinkedIn for content marketing. (Business 2 Community)
66. 93% of B2B marketers find LinkedIn the most effective social network for B2B lead generation, and 77% say they have acquired a customer through LinkedIn. (Business 2 Community)
67. Each second, two new members join LinkedIn – the equivalent of the entire enrollment of the Ivy League joining every day. (#Socialnomics 2014)
68. There are, on average, eight new LinkedIn groups created each week, and 200 group conversations per minute. (Social Media Slant)
69. LinkedIn (74%) and Tumblr (54%) are the only social networks that U.S. users access predominantly via desktop. (Social Media Slant)
5 Facebook Statistics
70. Facebook posts with less than 250 characters get 60% more engagement. (SteamFeed)
71. Nearly half (45%) of B2B marketers say their company has gained at least one new customer through LinkedIn. (Gerardo Lara on Pinterest)
72. 52% of digital news consumers say they get at least some of their news from Facebook and Twitter. (Digital Information World)
73. Facebook has 802 million daily active users–609 million on mobile devices. (Social Media Slant)
74. Posting to Facebook on Fridays is likely to result in better engagement: 17% of weekly comments, 16% of weekly likes and shares, and 25% of videos played occur on that day. Updates posted on Sundays generate the fewest comments. (Social Media Slant)
2 YouTube Statistics
75. YouTube reaches more U.S. adults 18-24 years old than any cable network. (SteamFeed)
76. U.S. marketers spent $ 2.8 billion on online video advertising in 2013. (MediaPost)
6 Pinterest Statistics
77. Pinterest outperforms Twitter and LinkedIn in the time spent on each network. (SteamFeed)
78. Almost half of all Pinterest activity is on tablets. (SteamFeed)
79. For online retailers, Pinterest (24.3%) and Facebook (24.2%) drive the highest share of social revenue. (AddShoppers)
80. Pinterest now hosts roughly 30 billion pins on 750 million boards. (Social Media Slant)
81. 100,000 of Pinterest’s members are retailers. (Social Media Slant)
82. 92% of all pins are posted by women, and as of April 2014, there were 15 times more pins by women than by men. (Social Media Slant)
5 SEO and SEM Statistics
83. One-third of all organic search clicks on Google are on the first result. (SteamFeed)
84. 43% of all online advertising dollars are spent on search ads. U.S. marketers spent $ 18.4 billion on paid search ads in 2013. (MediaPost)
85. 72% of PR agencies are now offering SEO services. (MarketingProfs)
86. Each day, 20% of the terms typed into Google have never been searched before. (#Socialnomics 2014)
87. By 2018, one of every $ 10 spent on digital marketing services will be spent on SEO. (MediaPost)
7 Email Marketing Statistics
88. By industry, the highest average email click-through rates are in media/publishing (20%), software/SaaS (19%), and technology equipment/hardware (14%). The lowest are in real estate (8%) along with education/healthcare and nonprofits (both at 7%). (MarketingSherpa)
89. As of 2013, there were 3.6 billion email accounts (roughly one for every two people on earth). (HubSpot)
90. 91% of consumers check their email daily. (HubSpot)
91. 74% of consumers prefer to receive commercial communications via email. (HubSpot)
92. Suppressing anyone in your list who hasn’t engaged with your emails in over a year increases your deliverability rate by 3-5% immediately. (HubSpot)
93. For ecommerce merchants, the average value of Twitter share is 85 cents and the average value of a Facebook “like” is $ 1.41. But the average value of an email share is $ 12.10. (AddShoppers)
94. Also for ecommerce merchants, email subscribers convert at more than twice the rate of those reached through Google+ or Facebook shares. (AddShoppers)
12 Mobile Marketing Statistics
95. Half of all clicks on mobile banner ads are accidental. (SteamFeed)
96. CMOs say their top two areas for digital technology investments over the next 3-5 years are mobile applications and advanced (predictive) analytics, each at 94%. (MarketingLand)
97. U.S. marketers spent $ 7.1 billion on mobile ads in 2013–more than double the amount spent in 2012. (MediaPost)
98. 61% of marketers specify social media as the most critical area of focus over the next 12 months, followed closely by mobile at 51%. (FierceCMO)
99. 48% of emails are opened on mobile devices. But only 11% of emails are optimized for mobile. And 69% of mobile users delete emails that aren’t optimized for mobile. (HubSpot)
100. 25% of emails are opened on iPhones. (HubSpot)
101. As of January 2014, 58% of American adults owned smartphones and 42% owned tablets. (Pew Research Center)
102. By the end of 2015, 81% of all U.S. cell phone users will have a smartphone. (Social Media Slant)
103. 63% of adult cell owners use their phones to go online; 34% of cell internet users go online mostly using their phones. (Pew Research Center)
104. 81% of cell phone owners use their phones for text messaging; 74% use their phone to get directions or other information based on their current location; and 52% use it to send or receive email. (Pew Research Center)
105. Many mobile marketers still don’t get it though. Nearly 70% of cell phone owners say they receive unwanted sales/marketing calls, spam or text messages on their phones. 25% say they receive these unwanted calls and texts at least weekly. (Pew Research Center)
106. Mobile sharing grew 2.6 times faster than desktop sharing through the first part of 2014, and now accounts for the majority of social actions. (Social Media Slant)
(400)