Social media reporting is a vital part of how your brand operates online. It helps when you are justifying spend to the boss, and showing value to clients.
But with the incredible amount of value attached to social media, it is important that you know what to include in those reports. Data in itself is interesting, but it might not be the kind of data you need, and you could subsequently end up wasting time and money.
Let’s take a look at the key elements of a successful social media report. The next time you’re presenting on your social media performance to the powers that be, or if you’re compiling your own information for insights into your brand, this post should give you some idea of what to focus on.

Be realistic
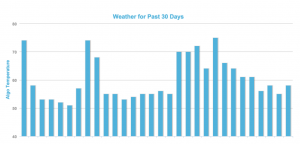
When preparing your social media report, be as realistic as possible when it comes to setting targets and comparing outcomes to a previous period. One thing you need to be clear about, for example, is the holiday period.
If you see a spike or a dip in holiday periods, it is not exactly fair to claim either of these two phenomena as being anything to do with your social media, unless you specifically created a high-quality campaign at Christmas that gained real traffic and conversions.
Of course, you can measure this traffic and the conversion because you are using metrics effectively, but don’t sit there and create a report that claims credit for spikes you had nothing to do with, or blame yourself for the opposite.
It’s all about being realistic and using that data to set targets for the future. With KPI’s, you need to be clear on what is happening, and what has happened in the past. Then you can set realistic indicators and targets that will make sense to everyone.
The words (or how to talk about this stuff)
Your terminology may be nothing like that of your boss. And if you’re creating social media reports for a client, chances are she doesn’t have a clue what ‘reach’ is. Get to the bottom of the problem or concept and explain it to the readers of the report in simple terms.
Of course, the people who are reading the report want to be assured that you know your stuff, but talking to a client about engagement and other metrics isn’t always going to make sense to anyone. Least of all the person who is paying for the thing.
Reach (with an explanation on spikes and drops)
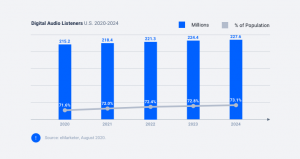
Reach is a crucial aspect of any social media report. It needs to be shown in the report to outline the exposure of the brand and its message online. How many people are in your audience online? How many people have been exposed to your content during the month? How many have engaged with your messages in the period?
You should be able to add even more value here by including the reason behind sharp increases (spikes) and decreases (dips) in reach. This could be something as simple as a holiday season slowdown, for example. Or a new content campaign you have launched during the month.
By explaining your reach every time it spikes and drops, you show complete control of the data.

The campaigns
Especially relevant if you are reporting to a board or management team. Highlighting the work done in specific marketing campaigns can really help to make sense of what is going on.
Obviously, this kind of information can be used to show the successes that have occurred. The ‘good’ news. But perhaps more importantly, any campaigns that are simply not giving you the results you expected can be identified, and flagged up.
Once you have identified the lame ducks, for example, using your data should allow you to pinpoint the reason why these issues arise. Pinning all of that information on the back of a thorough campaign report makes perfect sense.
The competition
Benchmarking is a key aspect of any self-respecting report system these days. If you have your reporting down pat, you will know that having an eye on what the other guys are doing really pays off.
Pick a competitor or two firmly in your ballpark when it comes to industry standing. Then benchmark your metrics against theirs. When you know how your competitors are doing, you can use that information to inform how you do things.
If they’re doing better, and you can tell this through the data, change and adapt so you can improve and catch up. If they’re not doing so well, see how your campaign is different, and keep it up. You can’t know unless your benchmarking is there.
This is great info to include in the social media report because it allows the readers to see how the company is doing. If it’s your company and your boss who is reading it, it shows detailed analysis that will reap results. If it’s your client’s company you are reporting on, it is simply adding incredible value. Knowing your position is always important, so get benchmarking.

Conversions
Conversion has always been a major part of social media, and the most obvious way to identify conversions is by using numbers.
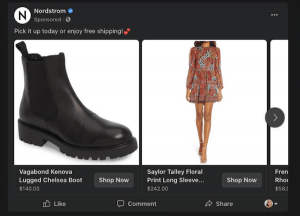
Take a look at your Facebook advertising. You should be able to pinpoint how many sales resulted from the ads, or how many leads were generated. This hard data gives you the advantage because it allows you to clarify which aspects of your social media marketing (paid and unpaid) are working.
You should be able to work out from your data which social media platforms bring you the most traffic. Once you have the information, you should then be able to see which of these traffic sources convert. And if you include this information in your report, it allows for detailed and thorough analysis.

Simple, again
We spoke earlier about ensuring that your report uses simple, clear language. Take this a step further and ensure that the report has as many visuals as possible. We can help out here a little in this regard.
Having a visual feel to the report means that information is immediately accessible. And if you are trying to convey impact, and issues such as reach and engagement, it always makes sense to include a chart or a graph that breaks things down so they are simple. They’re not five-year-olds, but clients and bosses need quick access to the important stuff. It’s quite complex when you think about it, so the more you help, the better.
To make your report super clear and simple, focus on the metrics that matter. If your client doesn’t need to know about traffic that comes from Twitter on a Tuesday afternoon, don’t show them this kind of stuff. Think about what your audience needs to know and nothing more.
Dressing the report up in fancy information that doesn’t really matter tells the people who are important that you are nothing more than a try hard. Focus on the key indicators and data that the audience wants to see, or needs to see, and make it as simple as possible. This gives you a ton of focus, and also ensures that your readers truly gain value. That’s the secret of successful reports.
If you’re responsible for social media reporting, don’t sweat it. Instead, focus on the key aspects above and your report should be useful, accessible, and above all accurate.

(83)