Walmart’s Real-Life Ad Fairytale Began In 2023

Ad budgets across Amazon Sponsored Products, Google Search, Facebook, Instagram, and YouTube in 2023 began with a whimper and ended strong, but one of the more interesting storylines from performance agency Tinuiti’s Q4 2023 Digital Ads Benchmark Report released this week came from Walmart.
Tinuiti’s report found that three-quarters of all Walmart’s search-advertising clicks were generated from its mobile app.
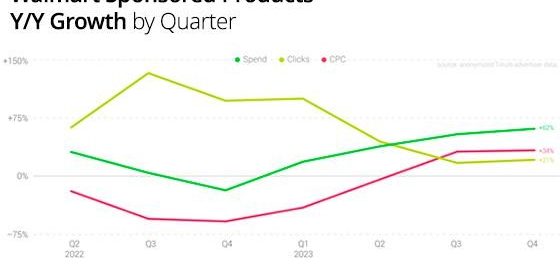
The investments advertisers made in Walmart Sponsored Products grew every quarter last year — peaking at 62% year -over-year (YoY) in Q4 after growing 55% in Q3.
Cost-per-click (CPC) growth topped 30% in each of the last two quarters of the year, following five straight quarters of YoY declines in CPC. This follows Walmart’s June 2022 move to switch from a first-price auction to a second-price auction.
As a result of the change in auction strategy, advertisers paid just enough to beat the competitor directly below them in auctions — as opposed to the full amount of the bid they placed — thus reducing CPC.
Google relied heavily on AI-based campaigns in 2023, transitioning Smart Shopping to Performance Max campaigns in Q3 2022 and its Discovery campaigns to Demand Gen campaigns beginning in Q4 2023.
Performance Max had the bigger impact as compared to Demand Gen campaigns. It was adopted by more than 90% of brands running shopping listings with Google and helped drive spending on Google shopping ads up 19% YoY in Q4, as well as Google search spending rose 17%.
Google began migrating Discovery campaigns to the new Demand Gen model in October 2023, which brought new advertising options to brands and additional inventory such as YouTube Shorts.
Adoption rates for Discovery campaigns had declined since early 2022, according to Tinuiti — spiking during the Q4 holidays for the previous two years except for Q4 2022.
The share of YouTube ad dollars that advertisers invested for television screens rose from 20% in Q4 2022 to 25% in Q4 2023, and the majority came at the expense of phones, which saw their share of YouTube spending fall four points between Q4 2022 and Q4 2023.
Desktop share also fell from year-to-year, while tablet spend share increased.
All device types saw an increase in spending from year to year, but TVs saw the most rapid spending growth at 44% YoY.
Ad spend on the Google Display Network (GDN) rose 6% YoY in Q4 2023 — up from 1% growth in the prior quarter — but impressions fell 10% YoY in Q4, down from 8% in Q3.
CPMs jumped 17% in Q4, vs. a 10% increase in Q3. GDN CPMs fell 5% Y/Y in the first quarter of the year, but CPM growth accelerated in each of the quarters since.
Facebook ended the year as the only platform analyzed in the report from performance agency Tinuiti to see a decline in growth between the third and fourth quarters, but it still experienced the most growth in 2023.
Meta’s Instagram continued to see the strongest growth, with spending up 27% YoY in Q4.
Across Facebook and Instagram combined, spending rose 13% in Q4, compared with flat in Q1. Facebook and Instagram saw newer inventory sources grow in importance during 2023, and advertisers took advantage of Meta’s AI-powered Advantage+ shopping campaigns.
Advantage+ shopping campaigns rolled out in Q3 2022, but had already accounted for 27% of retail Meta spend in Q4 2023.
Amazon Sponsored Products advertising spend rose 17% YoY in 2023, accounting for three-fourths of Amazon Ad Console spending in Q4 2023. Amazon expanded the reach of its Sponsored Products to offsite inventory on platforms such as Pinterest in the second half of 2023, but the impact to traffic volume has been minimal, according to Tinuiti data.
A majority of Amazon’s DSP investment continues to go to phones, which accounted for 57% of spend in the final quarter of the year, according to Tinuiti.
Tablets were the device type with the biggest YoY gain in share — rising from 8% of spend in Q4 2022 to 12% in Q4 2023.
Desktop computers accounted for 26% of Amazon DSP spend in Q4 2023, with 6% of investment going to connected televisions.
Amazon owned-and-operated (O&O) properties such as the Amazon app or IMDb gained more than half of all Amazon DSP spend in Q4 2023. They accounted for 46% of impressions.
Amazon O&O inventory, Tinuiti found, typically has a higher CPM than other Amazon DSP placements.
Amazon Publisher Services accounted for 18% of Amazon DSP spend in the final quarter of the year, with the remaining 29% attributed to other non-Amazon inventory.
(42)