
Even if you’re not a graphic designer, you can quickly and easily create attractive marketing-driven infographics for your website and social media feeds.
You’ve seen the beautiful, informative explainer graphics that have popped up all over the Web in the last few years. These “infographics” visually explain topics that may be too cumbersome or complicated to spell out in long-form text. They illustrate topics using charts, graphs, images and short bits of text to clearly communicate a message or explain a subject.
According to inbound marketing company Hubspot, Studies have shown that human brains process visual information faster than words. Visual information makes a more significant and lasting impact, as well.
Given the fast-paced, ever-changing nature of our lives, demands for our attention are increasing. If you’re trying to communicate a message, you need to do it fast. Infographics are an effective way to do this.
Humans began presenting information graphically as soon as they could scratch on cave walls. But fast forward to the ’80s and ’90s when innovative newspapers such as USA Today and Britain’s Sunday Times began to perfect the process of presenting data in graphically appealing and easily digestible ways using infographics.
As the Web has become our most-used communication method, the use of infographics has exploded. Check your Pinterest and Instagram feeds; you’ll see dozens of infographics on a wide variety of topics. They are the modern way to impart information, and we’ll show you how even non-designers can create highly successful infographics.
Step 1: What do you want to illustrate?
First, let’s think about the kinds of knowledge you can can you communicate with infographics by looking at some examples.
a) You can illustrate processes.
Let’s say your small startup company brews craft beer. You might want to create an infographic that details the process of making beer. You make a beautiful beer-making infographic, put it on your website, and then you send it out via all your social media channels. With any luck, the graphic goes viral and suddenly your microbrewery is flooded with customers.

From Visually.
b) You can use infographics to illustrate data and data trends. Maybe you own a coffee shop. You want to show which is the most popular brew among regular, latte, espresso and cappuccino. And you want to show numbers that indicate how many cups of coffee the average person enjoys per day. Put this data in an infographic, send it out, get some buzz, and voilá, the line of customers wanting a cup of your fine java is out the door!

An infographic showing the number of people who watch food shows. (From Venngage)
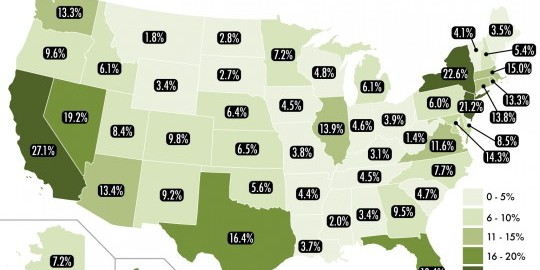
c) Infographics can also show geographical information (i.e. which part of the country has the most Pomeranians), a timeline (the 1980s at glance), and much more.

What Percentage of Each States are foreign born. From Visually
If you want to impress your boss, do a Powerpoint presentation with a series of infographics showing how you’ve increased your company’s Pinterest, Facebook and Twitter followers.
Step 2: How to create an infographic?
So once you’re on board with the usefulness of this communication medium, your next question may be, “How do I get some infographics for my website and social media?” You may not have the creative chops to build these visual beauties, or you may not know how to use sophisticated graphics software such as Adobe Illustrator. Or if even you do, who has the time? You could hire a graphic designer, but that can be pricey, and again, time-consuming.
The solution is easy. Build your own! You’d be surprised how easy it is. You needn’t panic if you’re not an illustrator or designer, because even non-designers can create beautiful infographics that communicate information simply and attractively.
Just build your infographic using any of a number of web-based applications that offer a step-by-step process to creating fabulous and attention-getting infographics.
All of these infographic builders have free and paid options, so you can try out the free templates, see if you like the software and then graduate to the paid plans as your needs become more sophisticated. The paid plans often offer more template options, a larger graphic library or extra upload storage. Some of the infographic-building services automatically add a watermark featuring their brand that you can remove only if you subscribe to one of their paid plans. Most of these services offer monthly and annual payment plans.
Here’s a quick snapshot of some web-based infographic-building services:
This tool offers dozens of templates to get you started, as well as access to a library of symbols such as shapes and arrows that you can incorporate into your graphic. Easel.ly offers terrific sharing tools, as well. The “pro” plan is $ 3/month and offers many more images, fonts and templates, the ability to upload your own fonts and files, and help from an Easel.ly designer.
This program offers a wide variety of templates for differing styles of infographics, including statistical, informational process, timeline, geographic, charts and surveys and many more. The paid plan is $ 19/month or $ 190/year and gives you access to “premium” templates and graphics.
Even with the free version of Piktochart, you’ll have access to more than 4,000 beautifully designed icons and images, and you’ll have access to all the editor functions. You can easily import data from a Microsoft Excel file, a Google spreadsheet or from your Survey Monkey account. Plans priced at $ 15 or $ 29 per month offer more uploads and other features.
This one offers several layout templates, and lots of beautiful art elements. Canva also offers you the ability to design fliers, cards, presentations, posters, Pinterest posts, business cards and more. The “Canva for Work” option is $ 12.95/month or $ 119.40/year and allows teams to share company media.
PowerPoint
You can even create an infographic in Microsoft PowerPoint. Inbound marketing company Hubspot offers free templates if you enter some information on their website (and subsequently, of course, get added to their e-mail marketing lists) .
Step 3: What to include
So after you’ve selected one of these online tools to create your masterpiece, you’ll then want to select a topic for your infographic. Pick something that makes sense for your business or for your brand.
Next, research your topic. Gather your data, using reputable sources. And document those sources — you’ll want to include them in your infographic (more on this later.) What are you trying to communicate? If you want to show numbers, be sure to have those numbers readily at hand. If you’re showing a process, write up the steps of the process in short, easy-to-digest nuggets.
Create a Word file or a Google Doc and type in your nuggets of information. Keep the info bits short and easy to digest.
Each of the infographic-building services has its specific modes of operation, but in general you’ll:
- Select a template (although some let you skip the template and just build using their library of backgrounds and images).
- Replace the “dummy” template text with your own text.
- Add your own text boxes as necessary.
- Replace dummy images with free images from their library, or upload your own.
- Change colors and typefaces to match your needs.
- Save your infographic out to your computer as any commonly used file type.
As you build your graphic, keep in mind these general guidelines for creating a successful infographic:
- Write a powerful, impactful headline that addresses your target audience
- Choose a cohesive color palette and stick with it. If you’ve established a palette for your brand, you might want to draw from it.
- Tall, vertical infographics tend to be the most attention-getting, and they fit best on social media, too.
- Limit yourself to one or two fonts; don’t get all crazy with a hundred different typefaces or readers will skip right over your infographic.
- Overall, keep your infographic simple and focused on your topic.
As you work on the lower part of your infographic, be sure build in a section to cite your sources. Adding citations about where you got the data in your infographic increases the credibility and the authority of your graphic and will lead to more sharing and publishing of your work. It’s also a nice shout-out to the people who gathered the data you’re using.
Also, don’t forget to add a call to action. What do you want to happen after readers have enjoyed your infographic? Do you want them to visit your website? Do you want them to donate money to a cause? Do you want them to go and vote? Make sure to tell them what their next steps should be.
Finally, add your branding. Include your logo or at the very least your company name and website URL.
Step 4: Share your infographic
When the infographic is complete, start sharing it. Post it on your website and on your social media channels. A number of infographic-sharing sites, too, allow you to post your work for even more exposure.
As you can see, it’s really easy for non-designers to create their own attractive and effective infographics. You don’t have to be an experienced graphic designer to take advantage of this important marketing tool. Sign up for one of the free online tools we detailed above, or use PowerPoint, and start creating today. We can’t wait to see what you come up with!
Digital & Social Articles on Business 2 Community(97)