While nearly all B2C marketers use social networks to promote their brands, social media marketing is by no means a one-size-fits-all solution. Across different industries, which social channels prove to be most and least effective? Which B2C brands build loyal, engaged communities, and which simply post content into the cacophony?
To find out, I used the TrackMaven software platform to analyze 10 months of social media content — a grand total of 342,489 social media posts and 795,230,787 interactions — from 213 leading B2C brands across 5 key social networks (Facebook, Twitter, LinkedIn, Instagram, and Pinterest) in 10 B2C industries (Apparel, Automakers, Consumer Products, Entertainment, Food & Beverage, Hospitality, Insurance, Restaurants, Retailers, and Telco & Cable).
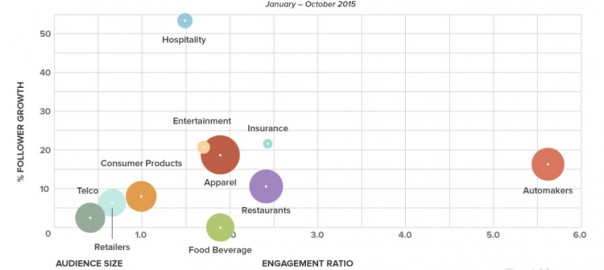
The findings — presented in the 2016 Social Media Impact Report: B2C Industry Edition — show which social channels really drive impact for brands in each sector, and which B2C brands outperform the rest of the pack. Here’s what the B2C landscape looks like on social media in one summary chart from the report:

The graph above plots the average follower growth, average engagement ratio, and median social media audience size for B2C brands by industry.
In a nutshell, a marketer should aspire to be in the top right of this graph. Score high on the Y-axis but low on the X-axis, and your brand is growing but not engaging your audience. Score high on the X-axis but low on the Y-axis, and your audience is interacting with your brand on social, but not bringing anyone new to the table.
So which industries excel on social media? Here are just a few of the key takeaways:
- Apparel, Insurance, and Entertainment brands are in the social media sweet spot. Brands in these industries have both substantial audience growth and content engagement on social media, indicating highly impactful social content. The Apparel industry’s 18.62% average follower growth is especially impressive considering the large median audience for brands in this sector.
- When it comes to social engagement, Automakers rule the road. Automakers don’t have the biggest audience overall (that honor goes to the Apparel industry), but they do know how to engage the followers they have. With an average engagement ratio of 5.62, brands in this sector drive community interaction every time they post. Insurance brands are a distant second, with an engagement ratio of 2.43.In contrast, Hospitality brands are at the top of the Y-axis, leading the B2C pack in social media audience size. But despite this massive audience growth (53.34%), their engagement ratio is just middle-of-the-pack (1.49).
- Food & Beverage audiences are shrinking. Food & Beverage is the only industry with negative follower growth across the period of study (-0.06%). Across the industry, large beverage brands — including Coca-Cola and Dr. Pepper — experienced a decline in Facebook followers across 2015. This finding is likely due to the brewing backlash against big soda, underscoring that consumers vote with their “Follow” on social media.
Digital & Social Articles on Business 2 Community
(73)