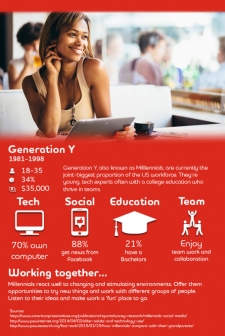
by Hilary Jarman July 13, 2016July 13, 2016 The modern workforce now includes employees spanning three distinct generations. While all employees are inherently different despite age, differences between these generations do follow common themes– each has its own knowledge, strengths and weaknesses. Managers must know how to work with them all to maintain a successful … Continue reading Multi-Generational Employee Motivation [Infographic]
Tag Archives: Infographic
5 Reasons Why a Custom Designed Website is Better Than Website Templates [Infographic]
by Stacey Rudolph July 11, 2016July 11, 2016 Deciding whether to hire a web designer or simply purchase one of the thousands of web templates online can be a daunting task. For many people, hiring a custom web designer is a waste of money considering the fact that you can buy a website template for … Continue reading 5 Reasons Why a Custom Designed Website is Better Than Website Templates [Infographic]
From Gig to Career: The Rise of the Sharing Economy [Infographic]
by Jennifer Hanford July 9, 2016 Follow @jennghanfordJuly 9, 2016 Whether you’re a a seasoned freelancer or seeking freelance work for the first time, you’ve probably noticed how businesses such as Uber and Airbnb are hiring. These companies are only two examples of the burgeoning “sharing economy.” What is the sharing economy? Well, start with … Continue reading From Gig to Career: The Rise of the Sharing Economy [Infographic]
How To Make an Infographic From Your Poll And Survey Data In 4 Steps
by Sara McGuire July 10, 2016 Follow @sara_mcguireJuly 10, 2016 Survey and poll data are one of the most common types of content you see in infographics. That’s because poll and survey data typically translates beautifully into charts and graphs. When done right, visualization brings data to life. An infographic can make information more easy … Continue reading How To Make an Infographic From Your Poll And Survey Data In 4 Steps
Paid Media “Molecule” Shows How To Accurately Track Performance With Attribution [Infographic]
by Lauren Frye July 10, 2016July 10, 2016 Based on the Periodic Table of Marketing Attribution, this paid media molecule assembles elements from the attribution table into a molecular structure to visually demonstrates how attribution can build an effective revenue reporting system for paid media campaigns. This molecular configuration shows the powerful complexities of touchpoint … Continue reading Paid Media “Molecule” Shows How To Accurately Track Performance With Attribution [Infographic]
How to Send Emails Like a Pro [Infographic]
by Louis Foong July 7, 2016 Follow @thealeagroupJuly 7, 2016 215.3 billion emails are sent and received every day. 70% of digital marketers consider email marketing to be great for ROI, but this isn’t the case if your emails are badly-crafted, badly-timed, or badly-targeted. Sending the wrong message to the wrong person means that you’ll … Continue reading How to Send Emails Like a Pro [Infographic]
Top 5 PPC Mistakes to Avoid [Infographic]
by Venkatesh C.R. July 5, 2016 Follow @dotcominfowayJuly 5, 2016 When doing marketing on the internet, there are a number of crucial facts which you should take into consideration so as to avoid failure in your campaign. With PPC, here are some of the things that you should avoid for the best results. Keyword Overload … Continue reading Top 5 PPC Mistakes to Avoid [Infographic]
How to Improve Your Website Speed [Infographic]
by Cent Muruganandam July 5, 2016 Follow @centmuruJuly 5, 2016 There are Billions of websites on the information superhighway. Some quick ways of standing out from the crowd is with graphics, images, functionality and user experience. It is increasingly becoming more important to focus on website speed and load time. Google is putting more emphasis … Continue reading How to Improve Your Website Speed [Infographic]
The Power Of Hashtags On Twitter [Infographic]
by Warren Knight July 5, 2016 Follow @warrenknightJuly 5, 2016 DID YOU KNOW: THERE ARE 500 MILLION TWEETS SENT A DAY… THAT’S 6,000 TWEETS A SECOND! I remember the day Twitter joined Facebook in the world of social media. Ever since March 2006, Twitter has been my favourite social network without question. Whilst I enjoy … Continue reading The Power Of Hashtags On Twitter [Infographic]
The Summer of Social Video (Infographic)
by Bob Hutchins July 4, 2016 Follow @BobhutchinsJuly 4, 2016 As video content becomes cheaper, faster, shorter, and looks nearly professional-grade with consumer equipment (lookin’ at you iPhone 6)… it’s also becoming social. Whether or not your audience watches video is no longer a question. In 2016, we’re simply interested in where the audience goes … Continue reading The Summer of Social Video (Infographic)