Do you want a global perspective when it comes to ad spending on social media? Social media advertising has had an impressive growth in the past and its future only looks bigger & brighter. Viewing this growth will force many marketers to start spending in the social arena.
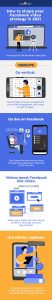
Below is a detailed infographic which highlights the global spend and breaks down the numbers as per region & social network. All this data will help you in creating better social ads n 2015 & coming years as well! Let us get started straight away with key facts & predications mentioned in the graph.
- Social ads on Facebook have risen to 54% since 2013 and one of the main reasons being due to the positive results advertisers are gaining. Also the rate for cost-per click search ads rose by 8% in 2013.
- 56% of Facebook users have said they have clicked on an advertisement and over 500K pages are paying to promote posts. (clearly this is why there has been a rise in advertising on this platform)
- Hence it comes as no surprise that Facebook is the most preferred social platform with 92% of advertisers. At second place is social video site YouTube at 35%, while Twitter is in third with 23%.
- The average worldwide cost-per click rate increased by 24% and cost- per thousand rate per impressions grew by 140%, both in 2013.
Mobile Ads
- U.S. mobile social ad revenue was at $ 1.5 billion in 2013 and by 2018 the number will grow by fivefold to $ 7.6 billion. This translates to a 38.3 growth rate and clearly shows that mobile market will be at its tipping point.
- 59% of Facebook and 81% of Twitter advertising revenue comes from mobile devices. Need I say more?

Other Key Facts
- North America ad share spending has been seeing a drop from 43.2% in 2013 to 40.2% in 2016. Asia Pacific will show a slight increase, going from 2013’s 28.6% to 31% in 2016. Western Europe and Middle East as well show a slight growth; meanwhile Latin America and Central or East Europe also will experience a drop in spending.
- Digital ad spending was at a low in 2013 at 9.4%, but that will increase to 16.1% in 2016. As brands realise the importance of spending the percentage goes up as well!
- Worldwide spending per user will increase from $ 5.14 to $ 7.98 on average.
- 14% of Fortune 500 companies spend nothing on social ad buys, which really is an astounding stat!
From the above figures it is quite evident, that Facebook and mobile marketing are on the rise when it comes to advertising and are only going to be generating higher revenue!
Which statistics surprised you the most? Do share your insights with us below.
(252)