A look at Google’s new page experience signals called Core Web Vitals, how to optimise for them and why they present an exciting opportunity for marketers.
Back in May, Google announced a new ranking signal called page experience that’s due to roll out at some point in 2021. At the time, Google said the new signal was due to roll out much sooner but it put the plans on ice due to the fact that businesses were grappling with the height of the coronavirus outbreak.
Page experience is a combination of existing ranking signals and a new set of signals called Core Web Vitals, which aim to reward websites that deliver the best user experiences.
What is the page experience signal?
As we’ve explained in a previous article, page experience will combine a range of signals related to user experience into a single, measurable signal that Google can use to rate the UX of your website.
This visualisation from Google shows you how this new signal will be comprised:

As you can see, the “other web vitals” section includes a number of ranking signals that have been with us for quite some time now:
- Mobile-friendly: Rewards pages that deliver a positive experience on mobile – more information available here.
- Safe Browsing: Rewards websites free from security issues, malware, deceptive pages, harmful downloads and other safety issues – more info here.
- HTTPS: Rewards websites that have HTTPS secure encryption.
- Intrusive interstitials: Penalises websites that use intrusive interstitials and popups – more info here.
Mobile-friendliness has been a ranking factor since the so-called Mobilegeddon rolled out 2015 and Safe Browsing in 2007. More recently, Google has pushed website owners to use secure encryption and punished sites that use intrusive interstitials and popups – particularly on mobile.
All of these signals should be familiar to you by now but what about the three signals listed under Core Web Vitals?
What are Core Web Vitals?
Core Web Vitals is an initiative from Google that introduces three new ranking signals designed to improve the overall experience of high-ranking websites. Aside from the signals themselves, the initiative also provides developers with guidance for each signal and tools to test and optimise them.
The signals may sound unfamiliar, at this stage, but they’re easy enough to understand.
- Loading: This simply refers to loading times although Google is changing the way it measures this with a new standard called Largest Contentful Paint (LCP).
- Interactivity: Measures the responsiveness of interactive elements on your page (links, buttons, etc.) after users click them, using a new standard called First Input Delay (FID).
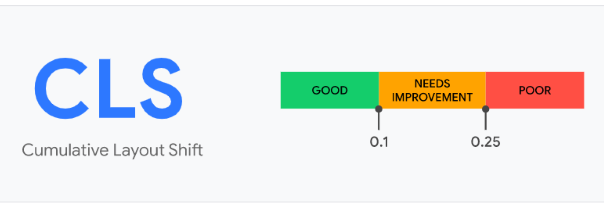
- Visual Stability: Detects the movement of elements after they’ve loaded on the page and any instability this causes, using a new standard called Cumulative Layout Shift (CLS).
Basically, Core Web Vitals want to see fast-loading pages, interactive elements that respond quickly to user interactions and elements that stay where they are without jumping all over the page.
From a UX perspective, it really is that simple. The complexity of Core Web Vitals lies in the new standards Google is using to measure these signals.
We’ll look at these in more detail shortly (and how you can optimise for each signal) but, before we do that, let’s talk about how important these new signals are from a ranking perspective.
How important are Core Web Vitals?
Everything Google is saying about the new page experience signal (and Core Web Vitals) suggests this is going to be one of the biggest ranking factors once it fully rolls out. Content quality will remain the most important on-page signal and off-page factors, such as the quality of inbound links, will be just as important.
However, page experience (including Core Web Vitals) will be a major signal and it could be the deciding factor between two pages that deliver a similar quality of content:
“While all of the components of page experience are important, we will prioritize pages with the best information overall, even if some aspects of page experience are subpar. A good page experience doesn’t override having great, relevant content. However, in cases where there are multiple pages that have similar content, page experience becomes much more important for visibility in Search.” – Google Webmaster Central Blog
Clearly, this is something website owners need to take seriously but there’s no need to panic over page experience or Core Web Vitals. As with all algorithm updates of this nature, there’s going to be a lot of sensationalist hype ahead of rollout but the overall impact on search rankings will be modest.
Let’s not forget the disastrous predictions being made about “Mobilegeddon” before the update rolled out, only for people to question if anything had actually changed.
Core Web Vitals are important but Google looks at hundreds of signals for every search which means there are hundreds of places for searches to be won and lost. More importantly, these new signals open up new opportunities for brands to get ahead of rivals who are slow to optimise – and this is something worth being excited about.
How to optimise for Core Web Vitals
The key to optimising for Core Web Vitals is understanding how Google measures each of the signals. So, in this section, we’re going to break down the technical details of the three signals, the tools available to optimise for them and some key tips for each one.
Loading: Largest Contentful Paint (LCP)
The Loading signal measures how long it takes your pages to load, in seconds. Loading times are already a ranking factor in Google’s algorithm but Core Web Vitals places more importance on page speed across all devices.

The key thing to understand about the Loading signal in Core Web Vitals is that Google is shifting to a new standard for measuring page speed. This is called Largest Contentful Paint (LCP) and you can find out more information about this standard here.
Essentially, LCP measures the time it takes for the largest image or block of text within the viewport (above the fold) to fully render. This makes a lot of sense because the largest of these elements should, in theory, take the longest time to load while their position in the primary viewport suggests they’re important to the user.
This replaces older measurement standards such as First Contentful Paint (FCP), which simply measures the time it takes for any part of the page’s content to fully render.
How to optimise for LCP
As you can see from the previous visual, Google wants to see LCP scores of 2.5 seconds or faster. If the largest element in the viewport of your pages takes any longer than this to render in the browser, you risk being penalised for the Loading signal in Core Web Vitals and page experience.

You can measure the LCP of your pages using a range of free tools provided by Google. First, you can measure loading times for live pages, using the following “field” tools:
You can also measure the LCP of pages in development by using the following “lab” tools:
If your LCPs are coming in at over 2.5 seconds, you need to optimise the pages that are underperforming. There are four primary factors that affect your LCP scores and these should be the focus of your optimisation efforts:
- Slow server response times
- Render-blocking JavaScript and CSS
- Resource load times
- Client-side rendering
To improve server response times, the first thing you need to do is make sure that your hosting service is good enough. Pay close attention to the hardware used on your plan and check that you have sufficient memory and CPU for your needs.
JavaScript and CSS are both render-blocking resources that delay LCP and you want to minimise the negative impact by optimising for your code and files.
You can reduce the delay caused by CSS by taking the following steps:
- Minify your CSS files to reduce their size
- Defer non-critical CSS so it loads after HTML content has rendered
- Inline critical CSS within your HTML file to remove the additional server request
To reduce the delay caused by JavaScript code, you can take the following steps:
- Minify and compress JavaScript files to reduce their size
- Defer unused JavaScript so it doesn’t slow down HTML rendering
- Minimise unused polyfills (you may have these if you’re using APIs unsupported by certain browsers)
- Reduce the overall use of JavaScript
- Ensure your JavaScript code is clean and efficient
- Reduce your reliance on JS plugins, themes and other resources using JavaScript code created by unknown, third-party developers
- Invest in a good developer to create and optimise your JavaScript code
JavaScript is one of the most common culprits of slow loading times and it doesn’t take much to clog up the limited resources of a web browser. So it’s worth making the effort to ensure your JS files and code aren’t getting in the way of LCP.
The other two big speed killers are the total number of server requests and the size of the files/resources being downloaded. To mitigate these issues, you should follow basic speed optimisation best practices for every page you create:
- Reduce the number of server requests (images, files, cloud, data submissions, API requests, etc.)
- Optimise and compress images
- Preload important resources
- Compress text files
- Use adaptive serving to deliver different assets based on the user’s connection speed
- Cache assets to reduce loading times for returning visitors
When it comes to optimising for page speed, less really is more and this means using fewer images, less JavaScript code, taking it easy on plugins and making the most of resource-efficient code (namely HTML and CSS).
Interactivity: First Input Delay (FID)
Loading times are only one aspect of speed that matters to website users. The Interactivity signal in Core Web Vitals allows Google to measure the speed performance of sites after the page has rendered by analysing the time it takes for interactive elements to trigger after the user clicks.
This applies to everything from links, buttons, UI elements, triggered animations and any other element on the page that users interact with via a mouse click or tap of the touchscreen.

Google measures this using a standard called First Input Delay (FID), which measures the delay between user clicks and event processing – ie: when the browser starts to respond to the user’s input.
So Google isn’t measuring the actual event processing time here, it’s simply measuring any delay between the moment a user clicks and the time it takes for the browser to start processing the event. For example, when a user fills out one of your forms and huts the submit button, FID measures the delay between that click and the browser responding to that click by starting the submission process.
It doesn’t measure how long the submission process itself takes.
It’s important to understand this because it’s the delay you need to optimise for to make sure your FID scores are up to par.
Why does Google measure interactivity in this way?
Google explains why it only measures the delay in event processes, rather than the time it takes for these processes to complete or the browser to update UI elements after running event handlers.
“Even though this time is important to the user and does affect the experience, it’s not included in this metric because doing so could incentivize developers to add workarounds that actually make the experience worse—that is, they could wrap their event handler logic in an asynchronous callback (via setTimeout() or requestAnimationFrame()) in order to separate it from the task associated with the event. The result would be an improvement in the metric score but a slower response as perceived by the user.”
Although event processing time and UI updates are both important to the user (and you should optimise them), these measurements would make it too easy for developers to game Google’s algorithm by switching to asynchronous event responses, which would improve metrics but hurt the user experience further.
That explains why FID doesn’t measure event processing times. Now, the reason it measures delays instead is that the most common cause of slow interactivity responses is the browser being occupied with other tasks – such as handling server requests for CSS and JavaScript files.
Basically, the browser can’t start processing event triggers until it’s finished with other tasks.
This also helps explain why Google only measures the first input after a page loads. The majority of interactive issues occur while the browser is busy with server requests and rendering content, meaning the first input typically suffers the most.
Another reason Google cites is that the first input delay has the greatest influence on a user’s first impression of your website and the perceived responsiveness of interactive elements.
How to optimise for FID
Unlike the Loading signal (LCP) in Core Web Vitals, you can only measure FID in the field – in other words, on live pages. This is simply because FID requires real users to interact with your pages. This means you’ve got a slightly smaller list of tools available to measure the FID of your pages:
- Chrome User Experience Report
- PageSpeed Insights
- Search Console (Core Web Vitals report)
- Firebase Performance Monitoring (beta)
The first thing you want to do to improve your FID scores is to reduce the number of server requests upon page load, minify your CSS and JavaScript files and optimise resources (eg: images) to reduce file sizes.
By minimising the amount of time the user’s browser spends executing server requests and downloading files, you’re doing two things:
- Reducing the risk of a user clicking interactive elements while the browser is still busy rendering the page
- Reducing the overall delay if they do click an interactive element while the browser is busy

In the image above, the golden lines represent times where the browser’s main thread is occupied. Here, the FID is multiple seconds long because the user happens to click an interactive element when the main thread is busiest and the browser is unable to respond to the user input until the main thread is finished with its current task.
If the user had clicked this element while the main thread was idle, the FID would be much shorter. Likewise, if the browser spent less time applying styles and JS code, the windows of idle time would be larger and any potential delays would also become smaller.
So minimising the main thread work is a priority and you can run a performance audit in Lighthouse for guidance.

You can also find general guidelines and best practices for minimising main thread work here.
With server requests, file sizes and the main thread all optimised for, it’s time to take another look at your JavaScript code. Browsers need time to process and execute JavaScript code and the longer this takes, the more time the main thread spends occupied.
Lighthouse also shows a warning when JavaScript execution takes longer than 2 seconds and the audit fails if execution takes longer than 3.5 seconds.

If your JavaScript response times are a problem, you can speed things up by taking the following steps:
- Optimise/reduce the amount of JavaScript code
- Only send the code that your users need by implementing code splitting
- Reduce reliance on third-party code
- Minify and compress your code
- Remove unused code
- Reduce network trips by caching your code with the PRPL pattern
While you can only measure FID in the field, Lighthouse is a “lab” tool, meaning you can run these reports during development to put your pages in a good position before going live.
Visual Stability: Cumulative Layout Shift (CLS)
The Visual Stability signal in Core Web Vitals measures the occurrence of page elements moving position after they’re fully rendered. In the wild, this results in elements jumping around the page as other elements load, resulting in unstable layouts and a host of UX issues.
In extreme cases, these can be critical issues.

Unexpected movement is normally the result of certain elements loading after others or the resizing of elements after they are rendered. This can be caused by asynchronous or dynamic loading, failing to define the dimensions of media files, the use of third-party widgets or a range of coding poor practices.
Google measures the occurrence of visual stability using a standard called Cumulative Layout Shift (CLS), which detects the movement of elements after they’ve been rendered in the browser.

Your CLS score is calculated based on how much of the viewport moved elements impact (Impact fraction) and the distance these elements move (distance fraction). Google then uses the following formula to calculate your layout shift scores:
Layout shift score = impact fraction x distance fraction
You can find a more detailed breakdown of this calculation here.
How to optimise for CLS
You can measure the CLS of your pages both in the field and in the lab by using the following tools:
Field tools:
Lab tools:
Google wants to see CLS scores of 0.1 or lower and you can improve your scores by following some basic coding principles:

- Always include size attributes on your images and video elements, or otherwise reserve the required space with something like CSS aspect ratio boxes. This approach ensures that the browser can allocate the correct amount of space in the document while the image is loading. Note that you can also use the unsized-media feature policy to force this behaviour in browsers that support feature policies.
- Never insert content above existing content, except in response to a user interaction. This ensures any layout shifts that occur are expected.
- Prefer transform animations to animations of properties that trigger layout changes. Animate transitions in a way that provides context and continuity from state to state.
You can find more information from Google about optimising your CLS scores on this documentation page.
Use Core Web Vitals to your advantage
Google says the page experience signals (including Core Web Vitals) could be the deciding factor between pages that deliver a similar quality of content. With competition in the SERPs always increasing and content quality on the rise, it’s getting more difficult to beat your rivals on content quality alone.
Core Web Vitals opens up a new space for brands to compete in the SERPs and this should be looked at as an opportunity to become more competitive in organic search.
While the new standards being used by Google to measure page experience are somewhat technical, optimising for them involves all of the same best practices you should already be following. The key difference is that the reward for delivering great experiences is about to increase and with a few tweaks to the code of your website, higher search rankings should be within touching distance.
Digital & Social Articles on Business 2 Community
(48)