Identify where you are with your data practices and learn how to get to the next stage of your website analytics process.
It can be intimidating to tackle the challenge of big data. While some tech-thinking companies have led the charge toward analytics, metrics and measurement, many companies are still grounded by the weight of having more questions than answers. How much data should I collect? What metrics are important to me? How do I get the best out of my investment?
If you’re ready to get up off the floor and dust off your data practices, it’s time to identify where you are and learn how companies mature to where they want to be. We will look at the four typical stages that companies go through when scaling website analytics.
Stage 1: Crawl
Every process must start somewhere – and this process should begin by asking the important questions about your organization. What are our effective key performance indicators (KPIs)? What are the driving factors that influence our business? What are the differentiators between our sectors of business that could influence our success?
Two factors to consider:
1. Important questions like those should be asked of all parts of your business. Marketing alone cannot answer these questions holistically without collaborating cross-departmentally. For example, marketing may surprise themselves with the insights and information that the shipping department or customer service team can offer for a better business understanding. A digital marketing team might think the company’s target demographic are young consumers, whereas in-store associates could tell them the reality is most shoppers are their parents. Website analytics sometimes don’t tell the whole story.

2. No answer is wrong! You must first set these benchmarks, as crazy as they may sound, to establish a philosophy that can be tested to see if it’s true. Consider yourself a researcher in your organization. Do you believe that time of year truly affects responses to marketing campaigns? Great – test these theories.
By establishing benchmarks, organizations can determine the proper way to collect the needed data to validate these guesses. To do so, find the largest white board available or create as many columns as you can in an Excel sheet – whatever your fancy – and bunker down until tough questions about your organization are answered.
Most importantly, this data should reflect aspects of your business that you can change or influence. In other words, working within your remit allows you to not only use the same process for each new test but also implement the results quicker and at scale.
Stage 2: Walk
You should now be able to determine which tools for your organization are needed – and subsequently which data points will be required – to test your theories. This can include general site metric collection such as Time Spent on Site or Bounce Rates or narrower figures like geographical distribution of high-value visitors.
Here are a few factors to keep in mind as you start this process:
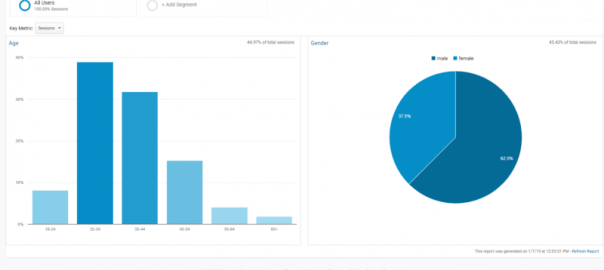
- Data collection tools are very good at giving you a lot of data, but many times it’s way more than you need. This results in companies attempting to collect as much as they can, getting overwhelmed with the results and entering in data paralysis. For example, Google Analytics can provide data about site trends, but it’s meaningless if the information is not tied to a business question.
- The data analytics space is overly cluttered with many competing solutions with a sea of logos in Scott Brinker’s landscape, so do your due diligence to find the right tools to reflect your needs. The tool is just the start; implementing and training will lead to a larger investment of time and money than is typically planned and requires more team members than many companies account for.
- Give yourself ample time to collect a rich data set before examining results to avoid anomalies or outside influences on your results such as the holiday season or a
summer lull.
Stage 3: Run
Now comes the fun part – take that data and run with it. Create an organizational plan to make adjustments and changes based on your results to affect business. Did you find that your average cart size for sales goes up on the weekends? If so, then create marketing tactics to drive users on weekdays that include 2 for 1 or “Buy $100 and get $25 off” methods designed to increase total order size. Your next step will be to start a new experiment to see if these tactics worked to increase weekday sales. If they did, you now know the factors that control your business, and that is incredibly valuable to individual and organizational success.
Most importantly, now is the time when you can factor things out. Did you believe that your loyalty program was influencing return sales, but it turns out it did not? This could mean that your loyalty program needs to be overhauled, or that it cannot be the crux of marketing activities. It can be just as important to learn and confirm what is not working as what is.
Stage 4: Fly
It’s time to soar. Many marketers view their website in a bubble. The truth is that a website is just one channel that users will interact with when engaging with your brand. And not every user is made the same – some will use it for research and buy in store in commerce scenarios while certain groups will use it primarily before speaking with a sales person in other industries. Now that you can properly track and map your website using the tools and methods you have found, it’s time to expand that thinking to other touch points. Are you mapping users from your website to in-store conversion? Do your local event sponsorships lead to users joining your mailing list? Do users who have a positive experience on your support channels typically become better brand advocates on their social media channels? What method can you use to link these sales?
It can be a daunting task to connect all the dots in a sales funnel from the start, so find those easy wins by beginning with your e-commerce or dot com channel and use those powerful data tools to learn what you need before moving to the next channel. For in-store or call orders, for example, customers can be incentivized to use their online session ID to make for easier cross-channel analysis.
Are you ready for the challenge?
The technology space for web analytics tools has skyrocketed over the last few years. Buzz words like “Customer Journey Analysis” and “Machine Analytics” create intimidating spaces that marketing teams are entering into with caution flags waving. Being a member in this space myself, companies that come in with a purpose and goal before considering tactics or tools succeed far more often than those just looking for the quick fix to satisfy the C-suite.
You won’t become an expert in a day. You might idolize those companies out there like Amazon and Google who seem to know about you before you know yourself. While they might be models of data collection and analytics, they took years to get there – their own Crawl, Walk, Run and Fly process that included many of the baby steps you might be getting ready to take. Enjoy the process, take your time and you will achieve your desired level of success, one answer at a time. Keep flying, so platforms and processes provide the complete view of business success you need to compete online and off.
Opinions expressed in this article are those of the guest author and not necessarily Marketing Land. Staff authors are listed here.
About The Author

Jeff Cheal is the Director of Product Strategy for Personalization, Campaign and Analytics at Episerver. He has an extensive background in advertising sales, software and marketing strategy. He is based out of New York, serving the North American market as an ambassador for the Episerver product suite, staying connected with both the partner network and customer base.
Marketing Land – Internet Marketing News, Strategies & Tips
(145)