Welcome to our latest study in which we look at 5,000 Facebook pages and their growth, reach and engagement results in the month of May.
Consider this your Facebook marketing round-up of the month. Not only do you see all the actual data that can help you run a page more effectively, but we also bring you all the interesting news and happenings you may have missed that could affect your page performance in the future.
There have been a couple of announcements in recent weeks, including the introduction of Author Tags and the news that the Time Spent On Post is now part of the news feed algorithm.
Lots to talk about so let’s get straight into it.

11% increase in the page likes growth compared to April
Facebook is constantly evolving their platform (there’s an “ongoing effort to improve News Feed” as they keep repeating), and this shows in our results month to month.
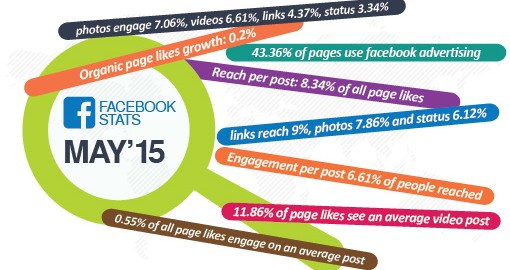
One area that is consistent from our report last month is the organic page growth. Trying to build a new Facebook page from scratch without using ads can be very difficult as the average page likes growth was at only 0.2% in May. This is an 11% increase compared to the 0.18% average growth in April, but still poor compared to 1.95% growth we see on Instagram.
The smallest pages (those with less than 1,000 likes) had above average growth at 0.28% but there was actually a 0.21% decrease for pages with over 1,000,000 pages likes.

43.36% of pages are using Facebook advertising
The slow organic growth leads us into the Facebook advertising platform which is increasingly becoming a cornerstone of marketing efforts online. There are more than 2 million active advertisers on Facebook.
43.36% of pages we looked at in our study used Facebook advertising, buying 31.51% of their total reach. Brands are realising that paid advertising is a great solution for their goals of growing a page and reaching a new audience. This is actually a 503% increase compared to only 7.19% of pages we saw using ads in April.
The larger the page, the higher the chance that the page is using ads. 48.28% of the largest pages used ads, while only 23.81% of the smallest pages did the same.

Consider Author Tags for a boost in audience and reach
One thing that’s worth considering for a boost in audience growth and an increase in reach is implementing the author tags into your website.
Facebook recently announced Author Tags and for multi-author blogs and websites it could be a way to reach more people.
The tag basically helps integrate the Facebook page or Facebook profile of the writer into the posts when they are shared across Facebook.
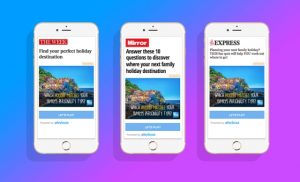
Users can now follow the writer and get updates about their future posts by clicking on the “like” or “follow” button as seen in the screenshot.

103% increase in organic reach per post
The average reach per post for pages we looked at was at 8.34% of all page likes in the month of May. This is a 103% increase compared to the 4.11% in April, and is very positive news for brands struggling to reach their audience organically.
The larger the page the less organic reach there is per post though. For pages with over 1,000,000 likes the average reach was 6.62% while for the smallest pages the reach was 14.88% of their audience.
58% decrease in engagement per post
The reach per post may be up but the engagement per post is down.
The average engagement per post was at 6.61% of people reached. This is a 58% decrease compared to the 15.58% engagement we saw in April.
The largest pages (those with over 1 million likes) had an above-average engagement of 8.92% of people reached.
This means that the average engagement per post is at 0.55% of all page likes, which again is poor compared to the 2.81% engagement of total following that we see on Instagram.
Time spent on a story: A note on content quality
Before we get into the reach and engagement data for the different content types it is worth noting the change Facebook announced on June 12th.
This is the quote you need to consider: “Just because someone didn’t like, comment or share a story in their News Feed doesn’t mean it wasn’t meaningful to them. There are times when, for example, people want to see information about a serious current event, but don’t necessarily want to like or comment on it. Based on this finding, we are updating News Feed’s ranking to factor in a new signal—how much time you spend viewing a story in your News Feed… We’ve discovered that if people spend significantly more time on a particular story in News Feed than the majority of other stories they look at, this is a good sign that content was relevant to them.”
This seems very much like the time spent on site / session time metrics that you see in your Google analytics.
They did end the announcement with “We do not expect Pages to see significant changes in distribution as a result of this update”, but it’s worth keeping in mind that Facebook is looking deeper than just the traditional engagement actions when considering which posts to surface in the news feed.
You need to make content that resonates with your audience. You need to draw them in and get them to engage with your content, and not only on the like/comment/share/click level but actually care about it and want to spend time on it.
Consider setting news feed audience targeting for each piece of content you’re publishing. This may restrict the reach of your post but will get it out to a more targeted and receptive audience. This will lead to more time spent on the content and more engagement.
Let’s take a look at how the content types performed in the month of May.
Videos lead the content reach
Videos lead in organic reach with 11.86% of page likes seeing a video post. Links reach 9%, photos reach 7.86% and status updates 6.12% of the total audience.
The largest pages had lower than average reach for all content types. Videos were still the best with 7.41% reach, while photos reached 6.58%. On the other hand videos reached 16.59% of the audience for pages with fewer than 1,000 page likes.

Photos lead the engagement
Photos lead in engagement with 7.06% of people reached engaging on average. Videos engage 6.61%, links engage 4.37%, while status updates engage 3.34% of people reached.
Photos engaged 9.32% of the people reached for pages with over 1 million page likes. Videos were second best with 7.38%. And it’s a similar story for the smallest pages with photos getting 9.33% engagement and videos getting 6.99%.

Things you should consider for your Facebook marketing strategy
Start using ads if you want to grow your page
It’s highly likely that your competitors are already using ads and you may be left behind. Especially if you’re putting a lot of emphasis on the number of Facebook page likes.
Implement Author Tags on your website or blog
in order to promote the writers. This may not automatically grow your main page but will increase the authority of your writers. Additionally, it will give you more touchpoints where you can reach people interested in content you’re publishing.
Set high quality control standards for your content
The quality of content that you publish will affect your page reach. Make sure everything you post targets your audience and is something they find interesting, compelling and useful.
Get familiar with the post targeting options
such as geographical restrictions and targeting by interest. Try them out and see what affect they have on your reach and engagement. You may very well find that the reach becomes limited but the targeting will help serve your posts to a more interested audience. This should lead to more time spent on content and increased engagement.
Introduce more videos and photos
Amazing photos (alongside great videos) should definitely become a cornerstone of your content strategy on social media as both reach and engagement numbers tell. Also note that animated GIF’s are set to be introduced to pages in the near future and this could lead to even higher engagement for visual content.
If you’d like to play around with the data and compare your own Facebook page to the pages in this study, do take a look at our Facebook Page Analyser. It’s free and updated daily with all the latest numbers.
(176)