For a lot of organizations, bounce rate is a meaningless part of reported KPIs. Contributor Alan K’necht explains how you can put bounce rate into context to give it greater meaning.

Over the 20-plus years since the inception of website analytics, various KPIs (Key Performance Indicators) have come into and gone out of fashion — and along with the KPIs are the various metrics that are used to calculate them. One of the reasons for this change is that as analytic tools become more advanced, extracting more meaningful metrics has gotten easier and less costly. Organizations are no longer held captive to easily captured and meaningless metrics such as “hits.”
But it’s critical that marketing and analytics professionals start to examine one of the last vestiges of old-school analytics: reporting bounce rate. While bounce rate still holds some value, its actual meaning and how it’s applied can vary among individuals and organizations. Yet its potential to reveal great insights is largely ignored in most organizations.
In an effort to explore how organizations currently use bounce rate in their reporting, I conducted an unscientific survey of a mix of analytics and digital marketing professionals. The first question they were asked was “Do you currently include bounce rate in your regular analytics reports?” At one time, the response would have been over 90 percent “yes,” but when I conducted the survey last month, it was only 68 percent.

This survey demonstrates that, like any metric, bounce rate is just a number. As I always say, “Numbers out of context are meaningless.” Many professionals fail to put bounce rate into context, and hence, render this metric meaningless.
Why is bounce rate becoming meaningless as part of reported KPIs? Think about these two examples:
Example 1:
An organization spends $100,000 to drive traffic to a specific landing page (e.g., PPC, SEO). The bounce rate is 95 percent, but the 5 percent who don’t bounce go on to convert and generate $250,00 in sales with a net profit of $50,000 (Revenue – marketing costs – cost of goods).
Is the bounce rate of 95 percent good or bad? It’s merely an indicator of potential further profits if the bounce rate can be lowered, but at what cost?
Example 2:
An organization spends $100,000 to drive traffic to a specific landing page (e.g., PPC, SEO). The bounce rate is 50 percent. Yet, of the 50 percent who didn’t bounce, only 20 percent (10 percent of the total generated traffic) go on to convert and generate a mere $150,000 in sales with a net loss of $50,000 (Revenue – marketing costs – cost of goods).
In this case, the bounce rate of 50 percent may be an acceptable bounce rate — or is it a bad bounce rate? It’s merely an indicator that something needs to be done to obtain a more profitable audience or perhaps narrow the marketing effort to a smaller number of people who could increase the bounce rate, but at a lower cost to obtain that traffic, turning a marketing loss into a profit.
The confusion over bounce rate between digital marketing and analytics professionals is evident in how they answered the second question of the survey: “Which most closely matches your definition of ‘bounce rate?‘”
The survey contained four possible answers, plus a fifth option to provide their own definition. For 46.9% of respondents, the choice was the most common definition of “Single Page Visit.” The answer of “They came, they saw, they vomited and left” (18.4 percent) combined with “They came and did nothing” (6.1 percent), both of which essentially classified bounce rate as a “came, looked around and left,” came out to 24.5 percent.
What’s more shocking — but perhaps explains why it’s losing favor as a KPI — is that 4.1 percent either didn’t know what a bounce rate is or how it’s calculated.

An enlightening part of the survey is that 24.5 percent of respondents chose to enter their own definition of bounce rate. As expected, these answers were extremely diversified, reflecting the issues we face in today’s web design in using bounce rate as a KPI.
How can bounce rate be used effectively?
With various clients, we’ve examined the typical user experience, and it goes beyond a bounce being a single page visit. The problem many content sites face is that they generate lots of organic search traffic to specific pages. Once the page is read, the user leaves the site.
Without any measurable action, this is a bounce, and time on page is zero seconds. Knowing that users come to read content, it makes senses to set up specific measurable events on the page to turn a bounce into an interactive engagement metric for these pages.
This problem also exists with “infinite scroll” pages, where a user can scroll down to multiple content blocks that effectively are multiple pages. A user could potentially scroll past three, four, or even five screens without tracking a specific event; the visit will be considered a bounce.
The solution in both cases is the creation of engagement events. These events can be either or both of the following: scroll interaction or a timer.
Scroll interaction
With “scroll interaction,” if a user scrolls past a specific percentage of the page, an event is recorded in analytics. Typically these are set at 25, 50, 75 and 100 percent. Of course, these percentages are easily configurable to a site’s specific needs. The added benefit is that when an event is triggered, the time it’s triggered is also recorded, generating a more accurate time on page than without it.
Time triggers
The second option (typically used for content sites) is to set a timer. The timer event is initially triggered after a predetermined number of seconds — typically 15 or 25 seconds to record the first event, and then an event is triggered every 10 or 15 seconds to ensure a more accurate time-on-page calculation.
The most difficult part of a time trigger is the setting of the initial event. One has to determine how long it takes a typical visitor to determine (without scrolling) that this page is a waste of their time and they close the session. Generally, some trials and testing are needed to get this set correctly.
Impact on bounce rate
By setting events (timers, scrolls, viewing a video, plus others types of interactions), the bounce rate reported in your analytics takes on a new and greater meaning. You’ll get a more realistic bounce rate, and time on page becomes more accurate as well.
I implemented this solution on a 100 percent content-based site. The sales team was shocked to see the bounce rate drop from over 80 percent to below 5 percent. Several advertisers started questioning the bounce rate, saying it was impossible to have one that low. But showing advertisers just how far down the content a typical user reads and where various ads were located (became visible during a typical visit) made the job easier on the sales team to sell ad positions lower down within the content.

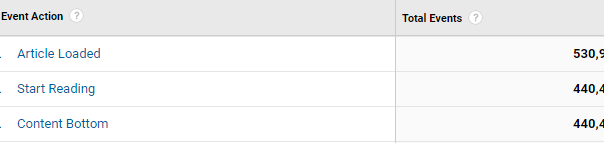
Note that by tracking when a site visitor starts reading (scrolls to a specific percent of the page), and then how many reach the bottom of the article, a more accurate bounce rate can be calculated. Only 17 percent of article visitors bounced (failed to start reading), and of those who started, nearly 100 percent read to the end of article.
Only by digging deeply into the meaning of all those KPIs we see nearly every day in our marketing dashboards, understanding how they’re calculated, and then configuring them correctly can we truly extract value from our analytics.
Opinions expressed in this article are those of the guest author and not necessarily Marketing Land. Staff authors are listed here.
About The Author

Alan K’necht an independant SEO, Social and Analytics consultant , a public speaker, award winning author and a corporate trainer (SEO, social media marketing & digital analytics).
Marketing Land – Internet Marketing News, Strategies & Tips
(102)