How do you create a world-leading optimization team? One that you can trust to consistently deliver ROI year after year?
Dedicated internal CRO teams are becoming increasingly common within businesses. As more and more companies adopt the testing culture, they start to ask the same questions:
- Where should we start testing?
- What happens when tests start losing?
- Is there an “optimization ceiling”? When is it reached?
- How do you prove a testing program’s value over time?
If you have asked any of the above questions, this blog post will provide the answers you need to turn your optimization team into a revenue doubling machine. I’d like to use a current example to show how WiderFunnel has answered those questions through our ongoing optimization services with the team at DMV.org.
Shane Hale, director of site optimization and conversion at DMV.org, was their one-man testing team when the company’s management realized they needed help if they were going to rapidly increase revenue. As Shane put it, “We felt we were behind. We knew there were inefficiencies, but didn’t know how far off we were, and what to do about it.”
My team at WiderFunnel has been working collaboratively with DMV.org on optimization for nearly three years and have run hundreds of tests. We’ve doubled revenue two years in a row and are now on track to do that again for a third year.
So, here’s the first question you should ask…
1. Where should we start testing?
When beginning to test, your team should determine which sections of the site are worth investing time, energy and resources. How much revenue lift can you really expect from sections of your site?
You’ll get the best results by running experiments on the highest-impact areas.
You can prioritize those with a framework approach. The PIE Framework can help you prioritize your A/B tests by ranking them based on their potential, importance and ease of implementation.
After you prioritize your experiments, you can develop a continuous, iterative, rapid-cycle testing process. Refer to Figure 1 below for an example of this process.

Click to view in a new window.
In this process, the Discovery phase informs the optimization Strategy phase, where the PIE prioritization occurs. Then, the Rapid Experiment Cycle constantly iterates through the experiment areas prioritized by PIE.
The insights you gain from your first test should be applied to every test that comes after. The PIE framework can help you make data-based decisions about where to start your tests.
Within the 7-step experiment cycle, the first step uses the LIFT Model, which is a framework that will help you create better hypotheses and, ultimately, better results and insights (in step 7).
Once your testing begins, you’re likely to run into the next question when you don’t get immediate positive results.
2. What happens when tests start losing?
There may be times when there are a series of losses. This can be disheartening — especially if results are reported to management and all they see are negative numbers. Maintaining momentum and support can become an organizational challenge that eclipses the technical challenge of running tests. To help with this, here are nine strategies for championing a culture of data-driven optimization.
The good news is, if you’ve prioritized properly and planned your experiments to produce insights, you never actually have a losing test. If you run tests properly, every test is a winner because no matter what the results, you gain new insight.
This was the case with the WiderFunnel and DMV.org teams. At one point, after six straight inconclusive experiments, the seventh round produced a huge 34% revenue lift.
How did we turn these negative results around? We analyzed each experiment’s results to understand why the performance changed, then built on those potential insights to produce different variations appealing to the user’s implied motivations. So, even when tests are producing negative numbers, they’re not losers if the experimental design is solid enough to know the next step to take.
For example, in one test, we hypothesized that adding personalization based on the visitor’s geographic location would lift revenue. We were surprised to learn that including the state name in the headline actually hurt revenue. In this example, personalization didn’t work.
Here are the two variations we tested:

That could have been disappointing, but it wasn’t because we always have two goals from testing: lift revenue and discover insights. Any experiment where you learn something new and can build new hypotheses for the next round is a positive.
Always trust the process. Remember: there are no losing tests if they’re designed properly.
When building a long-term optimization strategy, you may wonder about the next question.
3. Is there an ‘optimization ceiling’? When is it reached?
This is a question we’ve been asked many times, and answered before: Can you ever do too much optimization? (The answer is, “No.”)
If your experiments are designed to produce insights, uncover sensitivity areas, and create revenue lift, your work will never be complete, even throughout the years. Process-driven optimizers have proven that by seeing wins in the same websites over and over. As Shane Hale said it, “Even after two years, we keep having wins on the same channel. Damn. They just keep on coming!”
For example, after two years of optimizing that insurance banner, we tested six new versions with some radical departures. We tried different images — an image of a car, an animated GIF of a car, a dog driving a car, an image of a person, and one wild card: a totally different car-shaped banner (Variation E below).

Click to view in a new window.
Surprisingly, the car-shaped banner won by a landslide.
Our internal team (and our designer) couldn’t believe the results. We’d actually rejected a similar design in the past, but decided to finally try it. We were glad we did, because we learned new information about our audience. We’ve since tested other unusual shapes for the banner box and found even larger improvements.
And, if you compare between other variations, there are other potential insights. The animated gif, for example, did not out-perform the static image, which is counter to commonly held best practices. Also, the photo of the doc out-performed all of the more logical car insurance-related imagery.
The lesson: Sometimes you have to allow room to test variations from left field. You might be surprised what you learn.
In short, optimization teams implementing a determined framework for process-driven, insightful testing won’t reach an optimization ceiling as there’s always room for isolated improvements. And there are always questions to answer!
The objective of the process is to uncover a comprehensive understanding of the customer. This advances your team’s testing program from testing the hunt-and-peck method to asking important questions like:
- What insights did we get from previous tests?
- What did we learn about our customers?
- What other potential questions do we will have about them?
- What are our potential differences in different segments and different contexts?
Answering these questions with better and better data breaks down the proverbial optimization ceiling and lets your team continue to test and re-test the same channels.
4. How do you prove a testing program’s value over time?
Looking at your team’s tests over the year, how can you prove that the results produced from these tests translate to revenue in the bank? Perhaps your team has been asked how long a conversion lift will stick around. Does the lift start to decay after the test is complete?
The underlying question in doubters minds is: Are A/B test results reliable?
We decided to thoroughly test whether the A/B test results lasted over time.
Year One: Are A/B Test Results Sticky?
After six months of tests on one of the company’s most important revenue streams, we calculated the cumulative conversion rate of the winning tests: a calculated cumulate 32.8% lift in revenue.
To test whether the calculated lift was realistic, the WiderFunnel team used DMV.org’s original control page, from before the first test in the six-month timeline, and tested it against the latest winning variation. The resulted lift of 36.8% validated yes, the same statistically significance as the calculated lift.

From there, we continued with another six months of testing, and at the end of 12 months had a calculated 106.9% cumulative conversion rate lift. Again, we took the A/B test from the original control and tested it against the newest winning variation, and validated a 123.7% conversion rate lift.

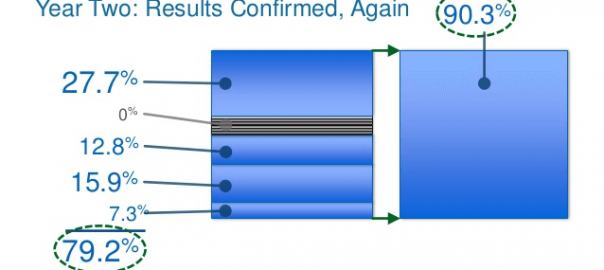
Year 2: Results Confirmed, Again
In the second year of testing, we went through a stint of six inconclusive tests. However, each of the tests gave us more insights about DMV.org’s users. The tests were structured in a way that produced insights so we learned something valuable from each one. We applied these lessons to a seventh test that returned a significant lift of 27.7%.
At the end of the second year, the calculated cumulative revenue lift was 79.2% — which was again validated by running a test of the newest variation against the control from 12 months prior. This A/B test got a 90.3% win.
What we learned is the A/B testing results did not degrade, did not disappear, and were very similar to (if not better than) the mathematically calculated results.

To answer the original question: “Are A/B test results reliable?” I believe this rigorous testing has answered that question with a resounding yes, at least for this business.
What can you learn from these examples?
When it comes to optimization, defining a process and a strategy are key to driving revenue. Good optimization teams are focused on long-term revenue lifts, not quick wins. A successful optimization program requires discipline, patience and a long-term view of results.
Digital & Social Articles on Business 2 Community(138)