
“Social media is not just a spoke on the wheel of marketing. It’s becoming the way entire bicycles are built.” – Ryan Lilly
I came across the above quote and thought it to be a great illustration of how social media has molded itself into a business’ marketing strategy. Yes, social media is taking over marketing. And the world.
Of course any good marketing strategy is built with statistics and data behind it – behaviors, interests, patterns, demographics, etc., and any good marketing strategist will make sure said strategy truly has the measurable data to back it up.
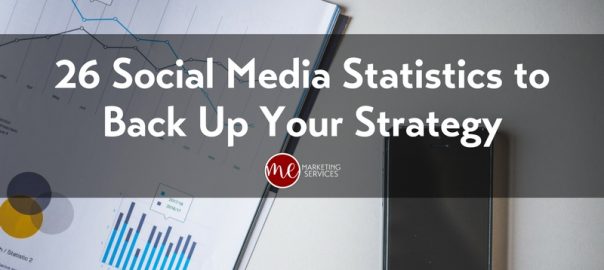
Being a fan of data and statistics, I love finding different bits of information among the common data we social marketing professionals regularly use. Some bits are eye-opening, some are really odd. Some make you sit and really evaluate what your actual usage behavior is, while some just make you laugh. Below are 27 social media statistics I have found while doing client research and putting together my weekly Marketing Fact Friday series. If you want to dig deeper, I’ve linked the source for you.
Social Media Usage
- Generation X (ages 35-49) spends the most time on social media: almost 7 hours per week versus Millennials, who come in second, spending just over 6 hours per week. (Nielsen)
- Almost 80% of time spent on social media platforms happens on mobile. (MarketingLand)
- 81% of millennials check Twitter at least once per day. (Pew Research Center)
- Nearly half (43%) of weekly Facebook activity and a third (33%) of weekly Twitter activity occurred on Sundays. (Nielsen)
- The number of active social media users worldwide is 2.78 billion, out of the world’s population of 7.47 billion. (we are social)
- Smartphones accounted for 78% of adults, ages 18-34, total weekly social minutes. (Nielsen)
- Adults ages 50+ spent 64% more time on social media in 2016 than in 2015. (Nielsen)
- 85% of people rely on Twitter and Facebook for their morning news. (Byte of Data)
Social Media + TV
- There were 11.8 million TV-related interactions on Facebook from 5.9 million people on average each day this fall. (Nielsen)
- On an average day, 42% of those interacting with TV on Facebook are Generation X, 40% are Millennials, and the remaining 18% are Baby Boomers. (Nielsen)
- 81% of engagement with TV-related Tweets comes organically from the audience. (Nielsen)
- 57% of people who used their tablet while watching television said they visited Facebook while doing so, compared with 24% who said they visited Twitter. On smartphones, those numbers were 58% and 20%, respectively. (Nielsen)
Social Media + Business
- More than 2 million advertisers regularly use Facebook to market their business. (Hootsuite)
- While 64 percent of marketers have a Snapchat account, only 67 percent of those accounts are active. (L2)
- 59% of Americans with social media accounts think that customer service through social media has made it easier to get questions answered and issues resolved. (Hootsuite)
- 13% of heavy social media users clicked on an advertisement within the last 30 days. (Nielsen)
- 30% of heavy social media users think it’s very or somewhat important to engage with social media in order to show support of their favorite companies or brands. (Nielsen)
- 93% of Pinterest users use the platform to plan or make purchases. (Pinterest)
Social Media Content
- Tweets with images received 150% more retweets than tweets without images. (HubSpot)
- When people hear information, they’re likely to remember only 10% of that information three days later. However, if a relevant image is paired with that same information, people retained 65% of the information three days later. (Brain Rules)
- 62% of B2B marketers rated videos as an effective content marketing tactic in 2016. (Content Marketing Institute)
- Cisco projects that global internet traffic from videos will make up 80% of all internet traffic by 2019. (Cisco)
- 51% of all video plays are on mobile devices — this growth represents a 15% increase from 2015 and a 203% increase from 2014. (Facebook)
- Cisco projects that global internet traffic from videos will make up 80% of all internet traffic by 2019. (Small Business Trends)
- Videos under five minutes in length account for 55% of total video consumption time on smartphones. (Ooyala)
- 85% of videos on Facebook are watched without sound. (Digiday)
Some of these statistics you may be able to use for your own business, or for a client. Having data to back up anything you propose or want to do yourself, is always key – it gives you and what you are proposing more credibility (as long as the data is from a credible source).
What kind of data and statistics are used in your business’ marketing strategy? Share with us below!
Business & Finance Articles on Business 2 Community(23)