— June 10, 2019
Infographics are great for creating helpful, audience-centric content. These visual content pieces make branded content alluring and easy for online searchers who’re looking for quick answers to their queries.
Infographics are among the top five content formats used by B2B marketers. – (Source)
Studies show that the human brain processes visuals 60,000 times faster. – (Source)
Infographics indeed work well to present content in an attractive way, but how do you create those awesome designs that your prospects love?

Here some proven ways to create some marvelous, result-driven infographics and make your content the talk of the town:
Choose a Topic
An Infographic is different from a blog post, and you must remember this while deciding a relevant topic. The visual content format is a representation of facts and stats – you need a topic that’s easy to break down into small parts. You can’t convert an opinion piece into an infographic, for instance.
Remember a simple ground-rule: analyze whether the topic can be explained with the help of short, snackable pointers, if yes, then you’re on the right track.
Here are some tips to find some interesting topics:
- Browse through the infographic designs of competing businesses.
- Brainstorm ideas within the team and jot them down in a mind map.
- Choose an infographic type:
- A timeline
- A how-to guide
- A comparison
- An assortment of charts
- A process flowchart
Make sure your infographic solves a problem– do a quick keyword research to understand the common challenges faced by your prospects.
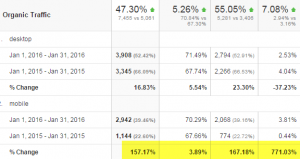
Take a look at this example:

A solid topic lays the foundation for an effective infographic.
Gather Data
You need to research on the topic to start collecting original and reliable data.
- Start by populating all the relevant links in a document.
- Next, you need to start picking up pointers and trends from each of these links.
- The infographic can be a mix of facts, stats, and steps; you can decide the proportion of each element depending on the topic.
- Work on finalizing what all goes in the design.
- Condense the content to make sure you can create a clean design.
Don’t delete the data sources as you need to give credit to each source at the end of the infographic design. Extensive research helps content creators to explore as much about a topic as possible. You can then boil down to the details that are most relevant to the topic and to your audience.
Write a Creative Brief
It’s essential to set the tone of the design – colors, fonts, the storyline (if applicable), and the style of graphics.
What will be the mood of the infographic? Will it be feel-good or funny or something else?
A creative brief helps the designer to start visualizing the design and create a wireframe.
- Don’t forget to include the audience persona in the briefing document.
- Add a few reference infographics.
- Every infographic must come with a distinct takeaway – do mention it.
- Include your brand guidelines for using the relevant fonts, colors, and logo.
A brief brings clarity on the goals and objectives of the infographic.
Develop a Wireframe
A wireframe helps you to put the design on paper and start visualizing it. It helps divide the design into various sections. Make sure your infographic comes with a few basic elements:
- A headline and an introduction
- The body – including sub-headings and the sub-sections
- The conclusion or a call-to-action
- The citations
The wireframe helps you do the groundwork before getting down to business.
Work on the Design
You can choose to go with a pre-designed infographic template or create a custom one. If the storyline is unique and requires intricate designing, then it’s better to go for a custom design.
The purpose of an infographic is to simplify information. A clean layout makes it easy for the audience to go through each element – graphs, charts, text, and visuals.
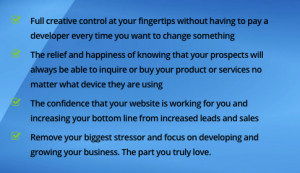
- Make sure to balance the design with respect to colors, placement of text, and visuals. Notice the consistency and finesse of the following infographic:

- It’s better to keep the text minimal and tell the story through visuals.
- Make sure the text font size is large enough for comfortable reading.
- You can use characters to breathe life into the design and make it more engaging.
- Don’t forget to leave out generous amounts of white space.
- The ideal width of an infographic is between 600 and 800 pixels while the height ranges between 2000 to 5000 pixels. The final size depends on the quantum of content and graphic elements.
- Follow the latest graphic design trends to make your design look more contemporary.
- Write a powerful headline to start building a connection from the word go.
- Leave out space for citations, at the end of the infographic.
A good-looking, balanced, and audience-centric design goes a long way in fetching new followers and evangelists for branded content.
Reach Out and Promote
The first step to spreading awareness is to publish the infographic on your business blog. Add a paragraph of text that introduces the topic and lets the audience know what’s in it for them.
- Optimize the infographic post for search by adding the relevant meta tags.
- Provide an embed code at the end of the infographic so visitors can share it with ease.
- Share the infographic post on your social media pages and in your newsletter.
- Create an outreach template to share the infographic with niche influencers and authority websites.
Promotions play a vital role in driving traffic and engagement to the infographic.
Over to You
The goal of content marketing is to educate and entertain the audience – the visual content format helps you do both. Infographics breathe life into branded content and make it more shareable. The format improves time on site, fetches backlinks and helps improve search rankings. So, are you ready to create an awe-inspiring infographic for your business?
Digital & Social Articles on Business 2 Community
(59)