
The amount of digital data is exploding.
Don’t believe me. Here are some stats:
- The amount of data available for analysis grows 20% each year
- Currently 1.6 Zetabytes of data exist – that’s equivalent to 47 years of HD TV programming
- 80% of data is unstructured, which is harder to analyze
- The velocity of data — amount of data generated per minute — has increased significantly
Managing the digital data explosion
Many companies did a relatively poor job analyzing data before the digital data explosion. For instance, a local grocery chain used scanner data to send automated re-orders to vendors, but never linked the loyalty club data with the items purchased. The marketing value of using this data far exceeds the logistical value.
And, they had the data!
With the digital data explosion, brands are literally drowning in data they don’t or can’t use.

Take a look at the diagram below. It shows:
- Most of the data available each years is digitized (99%) and over 1/2 comes with an IP address
- Data is generated automatically by mobile devices and computers — think Facebook, search queries, directions and GPS locations, and image capture
- Sensors also generate volumes of data, including medical data and commerce location-based sensors, such as . Experts expect 50 billion IP-enabled sensors by 2020
- Even storage of all this data is expensive. Analysis gets more important and more expensive every year
Firms need to revolutionize their ability to learn from this data, which requires statistical inference, such as predictive analytics, machine learning, and algorithms.

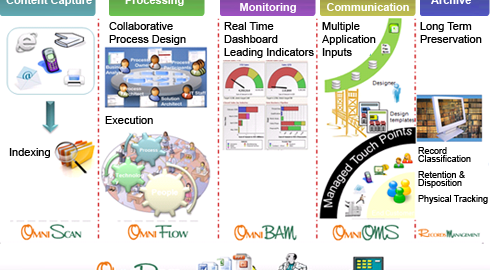
Enterprise content management company Soaring diagrams the steps necessary to effectively manage the digital data explosion.
The four steps are:
- Capturing data from a variety of sources including phones, websites, sensors, and other devices
- Processing the data by merging it, where possible, using IP addresses, customer information, and form completions. Data must be cleaned and structured to aid effective processing by data analysts
- Reporting and monitoring using real-time dashboards, marketing information systems, and interactive data management tools
- Communication with decision-makers and data input into tools designed to manage customer touch points, such providing appropriate information on the company’s website based on stage in the customer journey
- Archiving data for future use, which includes adding information to allow easy search at a future date
Improving insights from big data
Unfortunately, there’s no magic bullet that works for every firm, every type of data, and for every data use.
Medical devices produce a type of data that has multiple uses, for instance. It might need to go into a patients electronic medical record (EMR) or the data might be needed in an aggregate form to aid scientific inquiry or manage maintenance of the device — or all 3.
Banks and other financial institutions have a host of laws that they must follow, so tracking data should support their adherence to policy and law. But, they also need to manage customer accounts and understand the banks financial position.
As in our grocery example above, grocery stores need to manage scanner data for both logistics and marketing purposes.
McKinsey Global discovered:
… retailers exploiting data analytics at scale across their organizations could increase their operating margins by more than 60 percent and that the US healthcare sector could reduce costs by 8 percent through data-analytics efficiency and quality improvements.
Yet, the companies achieving these results, like Amazon and Google, are the exception, rather than the rule, according to McKinsey. Most firms see returns on the order of 1%. Is this a failure of big data or the firms use of big data?
The McKinsey study shows it’s mainly a function of not being able to scale analytics, so firms only use a slice of the business to apply big data or only do so on a test basis. It’s like they’re afraid to gamble on big data — and forgoing 59% of the return they could experience with effective analytics.
In their study, here are the reasons firms aren’t getting great ROI from analytics:
- Managers prefer data mining for diamonds rather than engaging in a sustained, scientific data analysis effort.
- Front-line managers fail to understand analytics, seeing results as “black box” tools that don’t generate faith in the findings. Hence, insights don’t translate into improved decision-making.
- Legacy systems within the firm actually impede use of analytics insights. It’s not an accident that companies like Amazon, which were formed around big data, thrive in the digital data explosion while their competitors simply drown.
- Data-driven firms have pushed decision-making down in their relatively flat organizations, while their competitors flail about awaiting approval from bloated organizational hierarchies.
Challenges to thriving in the digital data explosion

Image courtesy of IBM
First, firms need to hire skilled analysts to manage digital data. Only 18% of companies believe they have the skills to effectively analyze data. Unfortunately, there’s a serious shortage of trained BI (business intelligence) employees. And, in many cases, the few folks with the skill set to perform analytics are out of computer science and lack the understanding of business processes necessary to drive decision-making based on analytics and business schools have fallen short in adopting BI training in their curricula.
And, the salaries offered don’t match the skill set required. Hence, firms end up hiring folks inadequately trained in analytics with far too little practical experience to provide necessary insights.
Solution: hire or train those with business process understanding to manage data analytics
Secondly, organizational structure impedes use of analytics to drive decision-making.
Solution: Empower front-line employees to make decisions based on real-time data. Management experts argued for decades that flatter organizations were needed. Data analytics makes this imperative.
Third, organizations rely on data and analytics that’s anemic, especially in marketing. Over-reliance on vanity metrics and descriptive data handicap managers trying to improve their ROI with better insights.
Solution: Use predictive analytics (and prescriptive analytics) to guide decision-making and allocate resources. Algorithms rule the day. Build advanced analytics into the DNA of the firm.
Fourth, organizations fear automating activities might be inaccurate.
Solution: face it, machines are better at managing data than humans and make far fewer mistakes. For instance, the US government decided to slow down development of a self-driving car after one had an accident. Humans have accidents everyday and auto accidents are a leading cause of death in young people. Maybe they’re not perfect, but machines outdo humans when it comes to performing routine calculations.
Solutions for managing big data

Firms need to focus on hiring translators — people trained in analytics and business processes, for example.
Next, they need to overcome the organizational and cultural obstacles to using big data insights.
Make insights easier to understand and act upon, according to an IBM study that found this was a major deterrent to using big data. User interfaces for most tools are awkward and require a huge commitment to understand how to set up a problem. For instance, SQL has its own arcane language. When SPSS and SAS translated their languages through a series of drop-down menus, analytics became more accessible and understandable. SQL and other tools need to take a lesson.
Start by asking questions to solve business problems rather than seeing what the data can tell you. Instead of building insights, firms are too busy chasing their tails in data management and cleaning.
People are visual and looking at tables of numbers is mind-numbing. Instead, transform data into visual representations that ease analysis. Pie charts, line graphs, and other visualizations democratize analytics and speed insights, according to IBM.
Digital & Social Articles on Business 2 Community(172)