According to the 2015 U.S. Online Holiday Retail Forecast from Forrester, online sales are projected to exceed $ 95 billion during the 2015 holidays – an 11% growth over 2014. And more than any other time of the year, all eyes are on ecommerce. While online sales typically account for 10% of overall retail sales, Forrester also reports that this number will grow to 15% between the months of November and December.
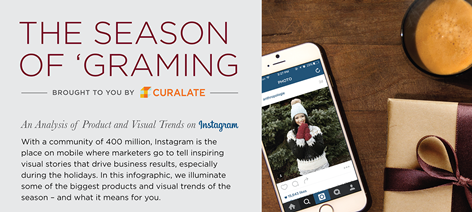
While marketers are using a greater number of digital channels than ever to reach consumers, few have proved to be more powerful than Instagram. With a community of 400 million, Instagram is a massive mobile destination for sharing creative, visual stories. Unsurprisingly, it’s expected to more than double its number of branded accounts—from 32 to 71% penetration—by 2017.
As the only full-funnel visual commerce platform, Curalate is essential to driving traffic and increasing conversions from Instagram. Together, our solutions provide more than 700 of the world’s most loved brands with the ability to both source and publish Instagram images at scale, while providing a direct path to products and content outside of the mobile channel.
With the holidays upon us, we thought it’d be an opportune time to dive into the data and explore which types of products and images are driving click-throughs on Instagram. Our findings are showcased in an infographic below, but first, let’s take a look at how we did it.
Unwrapping Instagram
At Curalate, we wanted to understand the value of Instagram for brands leading up to the 2015 holidays. To do so, we collected a sampling of images between September and October across brands with Curalate Like2Buy – a scalable solution that enables marketers to drive consumers from Instagram images to products and content outside of the Instagram environment.
From there, we surfaced the top 1% of images by engagement rate, meaning total outbound clicks from a brand’s Like2Buy gallery divided by the brand’s total Like2Buy impressions. This method allowed us to level the playing field and normalize the data against brands with relatively large or small Instagram followings.
With the top images in hand, our team went to work to determine what made them so engaging. Was it the type of product? The lighting? The vantage point? In total, we analyzed 12 different attributes per image based on how relevant they were. For example:
- Light vs. Dark (Are successful images light and bright or dark and dimly lit?)
- Human Element (Does having a person in an image drive clicks?)
- Indoor vs. Outdoor (Is the image taken indoors or outdoors?)
- Close Up vs. Zoomed Out (Is the camera focused in on a specific object or product, or is it zoomed out to provide additional context and detail?)
- Text Overlay (Is there text overlayed on the image?)
- Camera Angle (Was the photo taken from directly above the product or object (i.e. “Top Down”) or another point of view?)
By analyzing what made the top 1% of Instagram images so engaging, we were able to identify some really telling trends and draw some really compelling conclusions.
But we didn’t stop there. We were also curious how preferences for products and images differed across categories. For example, are fashion and apparel brands better off sharing images with bright, tropical colors, or are consumers more likely to engage with dark, neutral hues? Do companies in the cosmetics space benefit from having people in their photos? (Surprisingly, we found that the answer is no. About three-quarters of top performing beauty images simply focus on the product.)
So, we pressed on, digging even deeper and breaking down the data by industry.
The fruits of our labor, and answers to many of the questions above, can be found in the infographic below. We hope it provides some color around how you can best engage your Instagram audience this holiday season – and thereafter.
6 Key Holiday Insights
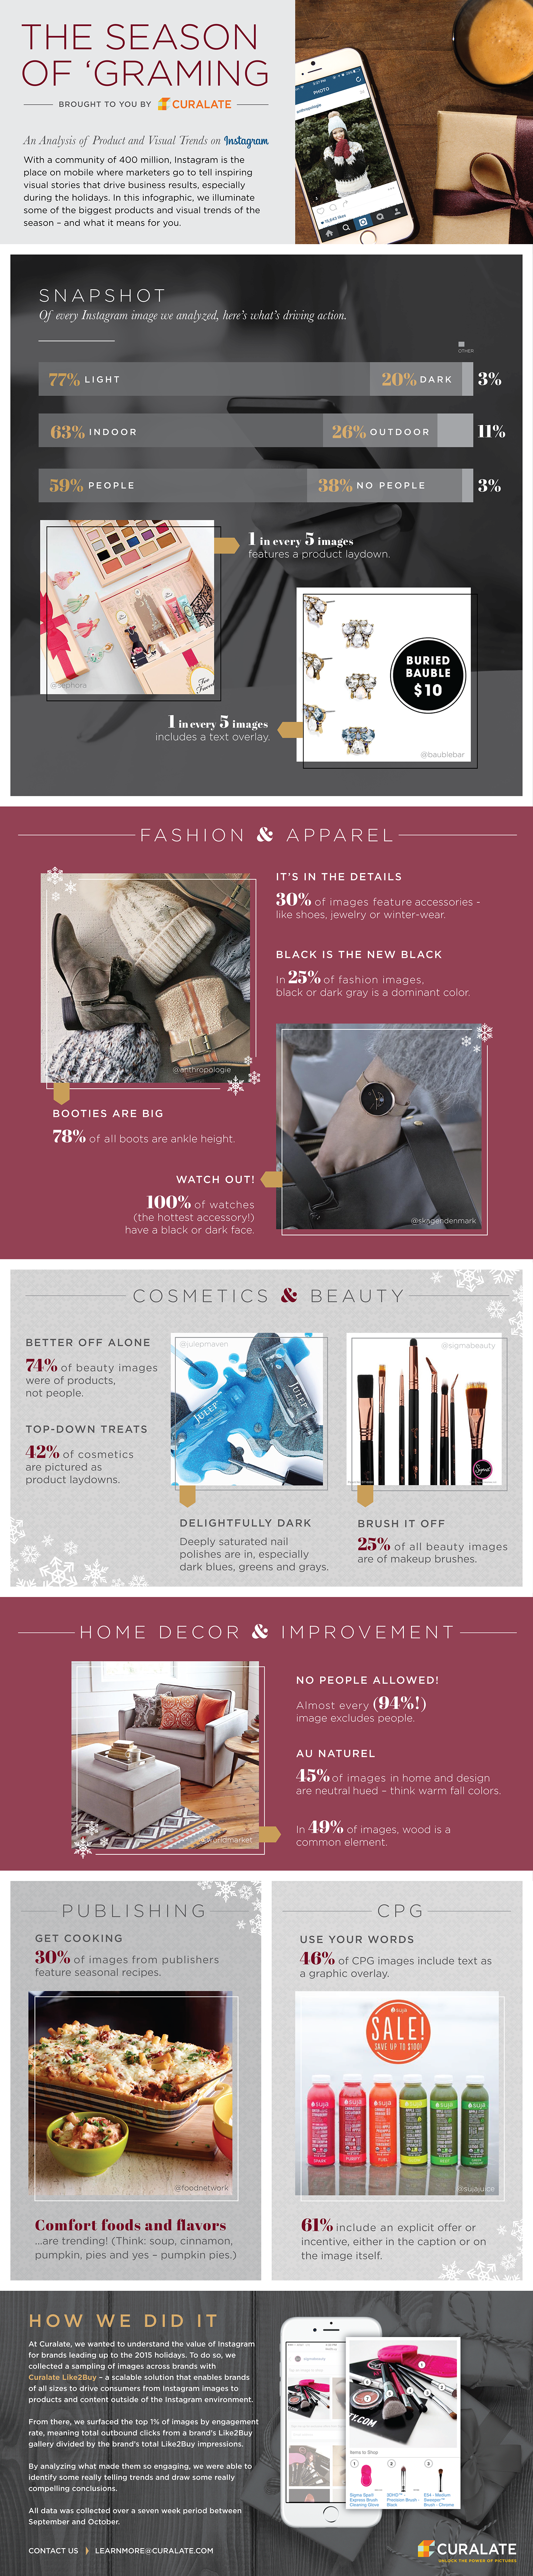
1. It’s in the details
Accessories seem to be generating a significant amount of buzz within the fashion and apparel space. Of all fashion-oriented imagery, 30% feature shoes, jewelry, or small giftable items likes hats and scarves. In addition, we found that booties are the most popular type of footwear. 78% of the boots we analyzed are ankle height. And on the topic of bling, watches emerged as the most popular type of jewelry. 100% of the watches we analyzed had black or dark faces.
2. ‘Tis the season
Whether you’re a publishing network, a CPG brand, or fall under home decor and improvement, it pays off to speak to comfort foods and flavors. Of the top images we analyzed, many contained ingredients and seasonings like cinnamon spice, gooey cheese, savory soups, buttery biscuits, pasta (it’s marathon season, after all!) and of course, pumpkin everything.
3. The weather outside is frightful
If it’s a bit nippy outside, don’t fret! 63% of the images we analyzed were taken in an indoor setting.
4. Not-so-silent night
While Instagram is nothing if not visual, there’s room for words. One in every five images we analyzed features text overlay to communicate a deal ($ 10!), illuminate a trend, or provide a word of inspiration or encouragement. What does this tell us? Images inspire consumers, but a few carefully selected words can drive action.
5. The big picture
75% of all top performing creative feature products that are photographed at a distance. This is particularly valuable for brands in the home decor and improvement category, where we found that 83% of images showcase not only the product but contextual details. By zooming the camera lens out (as opposed to a close up photo that focuses on just a part of a product), marketers are able to better convey what a product looks like “out in the wild.”
6. View from above
Product laydowns a highly engaging way to photograph products on Instagram. In fact, one in every five images we analyzed was taken from directly above a product or object, looking downward. This number is even higher for cosmetics and beauty brands. 42% of beauty images featured product laydowns. Have you experimented with this popular style of imagery?
Beyond the Holidays
According to research from MIT, the human brain can process entire images in as little as 13 milliseconds. In a world where images drive action, that’s how long it takes for a consumer to decide whether to click on your product photo – or to scroll past your content altogether.
While Instagram began as a channel for branding and awareness, it has emerged as a powerful driver of intent, traffic and revenue. With the right visual commerce strategy, you too can maximize your brand’s influence and connect with the hundreds of millions of consumers who are discovering products and brands on this important mobile channel.
Digital & Social Articles on Business 2 Community(42)