
When you conduct an online survey, it’s important to have a plan in place to interpret your results.
After all, what good is collecting feedback from your customers if you’re not going to be able to use it?
With so much going on, it can be difficult to find the time to sit down and review your results. But if you’re not taking the time to review the feedback you’ve received, you could be missing out on a valuable opportunity to grow your business and improve the experience you’re offering customers.
Consider this example:
An alumni association is planning an event for its members. They want to make sure the event is something that members will be excited to attend, and so they decide to go directly to their members to ask for feedback.
First, they brainstorm a list of event ideas.
They look at some of the events they know have received good attendance in the past, but also brainstorm a list of new ideas they think might generate interest.
Next, they create a survey asking one simple question, “How likely would you be to attend the following events?”
Since they want members to rate their likelihood on a scale, they choose a closed ended question and give five options:
- Not at all likely
- Not very likely
- Neutral
- Somewhat likely
- Extremely likely
Rather than simply asking “Would you attend this event, yes or no?” they are letting people rank their favorites, which will help the organization make a more informed decision.
With the survey ready, they can then reach out to members to get their feedback.
They include a link to the survey in their monthly alumni email newsletter and ask members to share their input.
After giving members time to fill out the survey, they export the results and review the responses.
The output from the survey looked like this:
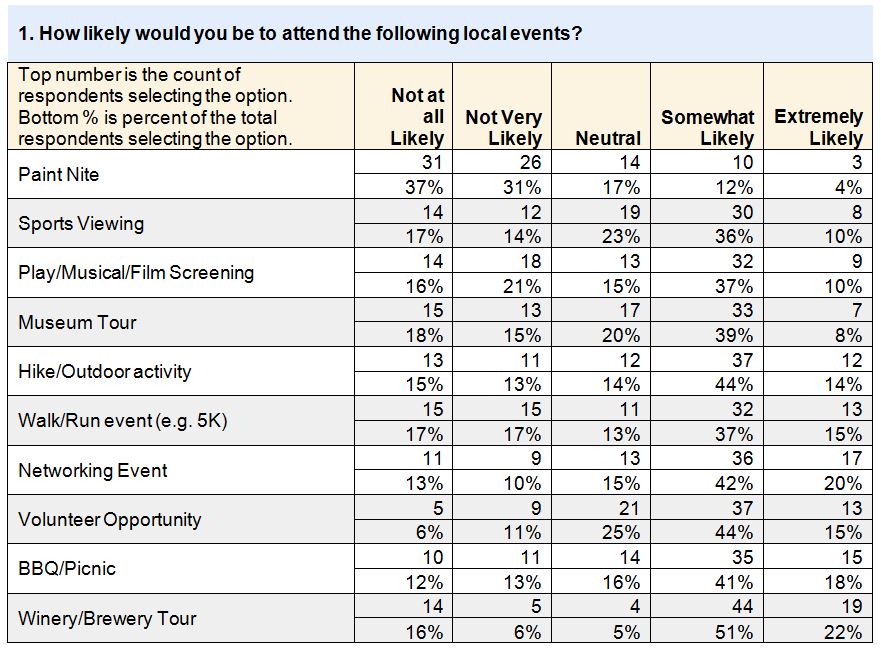
At this point, you may be feeling overwhelmed just looking at all those numbers. Let’s take a look at how the alumni association can interpret their findings.
First, make sure you understand how to read the report.
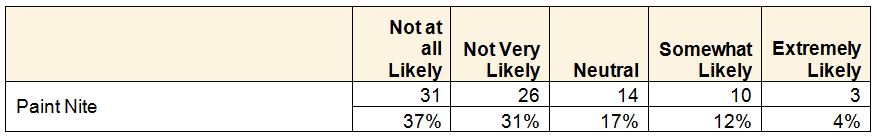
In this report, the first row reflects a count of the total number of respondents who chose each response option and the second row displays the percentage of members who chose the particular response option.
For example, when rating their likelihood to attend a Paint Nite, only three respondents (four percent) were “Extremely Likely” to attend.
Next, to help you decide which event(s) to plan, focus on the positive responses from the survey.
To help simplify, add the percentages from the “Somewhat Likely” column and the “Extremely Likely” column together.
Once you have added together those columns, you can rank order the grouped percentages from highest to lowest.
In this example, the alumni association would see that their classmates ranked a winery/brewery tour the highest at 73 percent, followed by a networking event at 62 percent.
A volunteer opportunity (59 percent), BBQ/picnic (59 percent), and hike/outdoor activity (58 percent) also did relatively well with the majority of respondents saying that they would be likely to attend these events.
They can also determine that paint night — which only had a 16 percent positive response — wouldn’t be the right choice for an alumni event.
Finally, decide what actions you will take from your data.
In this case, the alumni association is immediately moving forward with a Napa/Sonoma wine tour and an outdoor BBQ in Golden Gate Park. The data from this survey will continue to be a great reference for deciding which events to plan in the coming year.
Whether you’re planning an event, thinking about introducing a new line of products, or looking to expand your services — an online survey can help.
You can use an online survey tool, like the Constant Contact’s survey campaign, to collect feedback from your audience and easily export your findings to interpret your results.
If you need help along the way, we’re here to help! You can find additional survey resources here, and post your questions in the comments below!
(345)