— November 28, 2017

Tracking metrics are essential to evaluate the efficacy of any project or campaign. The same rings true for B2B website design projects and marketing campaigns. Enter Google Analytics, the search engine’s web traffic and website performance tracking tool. Not only does Google Analytics (GA) provide real-time and historical data about how visitors are getting to your B2B website, it provides data on how those users are engaging with your website.
We believe that no matter how skilled a digital marketer you are, it’s always a good idea to revisit the fundamentals from time to time. In this blog, we take a look at the essentials of Google Analytics for those new to the tracking platform or those who would like a quick refresh.
The Main GA Dashboard
Once you have analytics set up and the tracking code installed on your website or Google Tag Manager, you can begin monitoring and reviewing the traffic to your website. Logging into the GA platform will take you to the main tracking dashboard. Here, you get a quick snapshot of the tracking data for your B2B website design.
Overview of User Traffic & Behavior
The first thing you will see is an overview of the website’s user/visitor traffic and behavior. When you log into GA, the default timeframe is always the past seven days of traffic. From this example, you can see the traffic over the previous seven days, including the number of users, number of sessions, total bounce rate, and average session duration. Additionally, you get a snapshot of the active users on the website at that time (in the blue box on the right).

User = A unique visitor to the website.
Session = A session is a group of user interactions with your website within a given amount of time. Sessions time out after 30 minutes of inactivity, at midnight, or when a visitor leaves the website and then comes back through a different campaign.
Bounce Rate = A bounce is when a visitor only views a single page on your website and then exits the website. These visits have a session duration of 0 seconds according to GA.
Average Session Duration = The total duration of all sessions divided by the number of sessions during a specific time period.
Overview of User Acquisition
The next main section on the dashboard is user acquisition, which tells you how your B2B website attracts visitors.

This section displays the various channels that users follow to get to your website and includes Organic Search, Direct, Referral, Paid Search, Social Traffic, Email, and Other. This report is particularly helpful for attributing website traffic and leads generated to marketing campaigns.
Organic Search = Includes all search engine traffic to your website, including Google, Bing and Yahoo.
Direct = Refers to visitors that arrive on the website by typing the URL into their browser or clicking on a bookmarked link. However, this bucket of traffic also includes visitors who have advanced security settings and block cookies (or search engines) from tracking them.
Referral = These visitors are getting to your B2B website from another website or through a link to your website.
Paid = Visitors arriving via paid channels include pay-per-click and other paid channels, like retargeting ads.
Other = This is a catch-all category for when Google doesn’t know where to put certain traffic in the channel attribution.
Social = Visitors arriving via “Social” are getting to your B2B website from social networks, like Facebook, Twitter, LinkedIn, Pinterest, etc.
Email = Just as the name implies, these are users arriving on the website from a trackable email source, often from email platforms like MailChimp, Act-On, ConstantContact, etc.
Overview of User Activity
Following the channel attribution of website visitor traffic, you will see two charts that look at the activity of users on your website. This high-level snapshot looks at the top pages attracting the most visitors and the volume of visitors broken down by month, week, and day.

The top pages visited by users is a great indication of the type of content your audience is interested in and what pages are showing up in searches.
User Insight Data
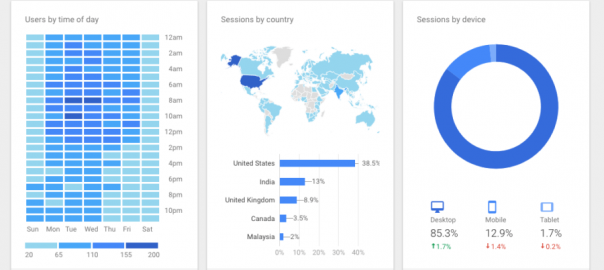
The next overview is a quick “when, where, and what” on website traffic by time of day and day of the week, geographic location of the visitor, and the device the visitor is using to access your website.

Tracking when users visit your company’s B2B website can provide valuable insight if you plan on implementing a live chat feature or scheduling a call center to handle incoming calls. The location of your users can be helpful in identifying new markets for growth or clarifying your buyer personas. The type of device provides background on how users want to engage with your website. For example, if 80% of your website traffic is on a mobile device, when you contemplate a B2B web design update, it would be beneficial to take a mobile-first approach to the general design and functionality.
User Retention and Conversion
The last two overview graphs in your main dashboard, unless you are using Google AdWords, relate to user retention and website conversions. These are great tools for getting insight into the sales funnel.

How well your website retains users can be helpful in evaluating the overall value your website offers to visitors, as well as learning more about how often prospects may need to engage with your website before they reach out. Goal setting is critical to evaluating the return on your marketing campaigns and analyzing the performance of all the different channels.
Always Analyze and Track Metrics
That’s the quick overview of Google Analytics tracking to help evaluate the ROI of your B2B website design and marketing campaigns. In our experience in B2B marketing, we find that the metrics always provide helpful insights for fine-tuning, changing, or discontinuing marketing campaigns. Never rely solely on anecdotal information or opinions regarding marketing campaigns, especially when budgets and attribution of leads are involved.
Digital & Social Articles on Business 2 Community
(53)