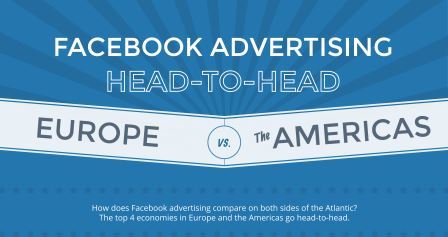
Columnist Andrew Waber delves into new data on Facebook advertising activity in Europe and the Americas and discusses the key takeaways for marketers.

Earlier this month, Nanigans (my employer) released its analysis and accompanying infographic of Facebook advertising activity in Europe and the Americas.
While the data alone presents a pretty interesting picture, delineating the takeaways for marketers requires a bit more of an in-depth look into the study results.
To recap, our guide to Facebook advertising in Europe and the Americas:
- Examined all Facebook-based ad campaigns run through Nanigans from January 1 through April 30, 2015.
- Analyzed spend, clicks and impressions, with all spend figures converted to US dollars for the sake of consistency.
- Encompassed hundreds of millions of dollars in ad spend and tens of billions of ad impressions across more than 45 European, North and South American countries. Specifically called out are the top four countries in Europe and the Americas, respectively, in terms of GDP.
Facebook’s Global Presence
Nanigans also utilized country-by-country Facebook user totals provided via Facebook’s API, together with the most recent population estimates available to determine Facebook reach as a percentage of a country’s population (click to see image in its own browser window):

As seen above, Facebook’s reach within the top four European and American economies totals more than half of the population within the United States, the United Kingdom and Canada.
As each of these countries has substantial English-speaking populations, their adoption of Facebook likely started prior to that of predominantly non-English-speaking nations that required more recent language support features.
Many South American Spanish-speaking countries also demonstrate high Facebook penetration rates, presumably doing so in a shorter amount of time than their English-speaking counterparts.
In both Uruguay and Argentina, 56 percent of residents possess Facebook accounts, with the latter achieving the mark even with a population of more than 43 million — greater than that of Canada (~35 million) and only slightly below Spain (~46 million).
This penetration rate is incredibly important to marketers focused globally. Recent surveys suggest that Facebook use is most concentrated in younger, more affluent subsets of the general population, but this is particularly true in developing markets where the cost of purchasing a computer or smartphone may initially be more prohibitive for a good deal of residents.
However, as smartphones become increasingly cheaper to manufacture, a greater percentage of consumers in many countries have the means to upgrade from more rudimentary cell phones.
This shift allows Facebook adoption to rise, and thanks to the real-world personas of an account, the resulting advertiser-addressable Facebook user base slowly becomes more diverse and likely more representative of the country’s population.
Analyzing Cost Per Click
Of course, in terms of measuring potential costs and ROI, a slightly clearer means of viewing the current state of each market can be done through an analysis of cost-per-click (CPC), as seen in the earlier graph.
In Europe, the UK’s high CPC may in part be driven by the country’s large mobile user base and robust ad infrastructure, developments that have been noted both in terms of growth and existing spend levels.
Looking specifically at mobile CPCs, Norway has the highest of any country, at $1.10, a full 31 percent more expensive than the UK’s $0.84 mobile figure and over 117 percent more expensive than the European mobile average of $0.51.
It’s worth noting that the UK and Norway have historically been more expensive places to advertise in general. In the latter case, Norwegian consumers are some of the most likely users to buy on their mobile phones, justifying the increased cost.
In terms of CTR, German users are the most likely to click on Facebook ads out of all European countries studied, at rates 63 percent above that of the European average. While German CPCs are also comparatively low, minimizing the cost of advertising, keep in mind that Facebook users constitute only 32 percent of the German population.
Test Your Campaigns
In markets like this, it’s worth testing campaigns to see what subsections of the population are most addressable via Facebook.
Looking at the Americas, Chilean mobile users exhibit the highest mobile CTR (1.5 percent), at a level equaling that of Europe-leading Germany. However, it’s important to note that there is much less variability in mobile CTRs within the Western Hemisphere, compared to Europe.
At a high level, the United States, Mexico and Brazil all have mobile user bases that click on ads at rates only slightly below that of Chile. While Germany outpaces the European mobile CTR average by 60 percent, this lead is only 14 percent in the case of Chile.
As such, it’s likely easier to estimate expected engagement rates for mobile campaigns running across multiple countries in the Americas, as opposed to multi-country European initiatives, even excluding the language differences.
While Europe and the Americas have generally been desirable markets for advertisers due to their sizable numbers of developed or developing markets, the stats above highlight that there remain some striking differences and similarities between countries on a number of key ad-specific metrics.
It’s worth keeping these differences, along with Facebook penetration rates, in mind when constructing a strategy in international markets, concerning expected spend, engagement and reach.
Some opinions expressed in this article may be those of a guest author and not necessarily Marketing Land. Staff authors are listed here.