Facebook is one of the fastest growing ad networks – in fact, the number of advertisers using Facebook has more than doubled in the last 18 months.
If you’re one of the 2 million advertisers who started advertising on Facebook in the past 2 years, you may have found that it can be easy to get overwhelmed on the new platform. Facebook has nearly countless ad targeting options to explore, and performance differs for every client. Just like on AdWords, performance can differ across different industries on Facebook, so what numbers should you be looking to beat in your industry?
We dug into our data to find out! Check out the Facebook ad performance benchmarks our clients are seeing, including:
- Average Click-Through Rate (CTR) on Facebook by industry
- Average Cost per Click (CPC) on Facebook by industry
- Average Conversion Rate (CVR) on Facebook by industry
- Average Cost per Action (CPA) on Facebook by industry
You’ll find averages across these Facebook metrics for eighteen industries: Apparel, Auto, B2B, Beauty, Consumer Services, Education, Employment & Job Training, Finance & Insurance, Fitness, Home Improvement, Healthcare, Industrial Services, Legal, Real Estate, Retail, Technology, and Travel & Hospitality. Let’s dig in!
Average Click-Through Rate on Facebook
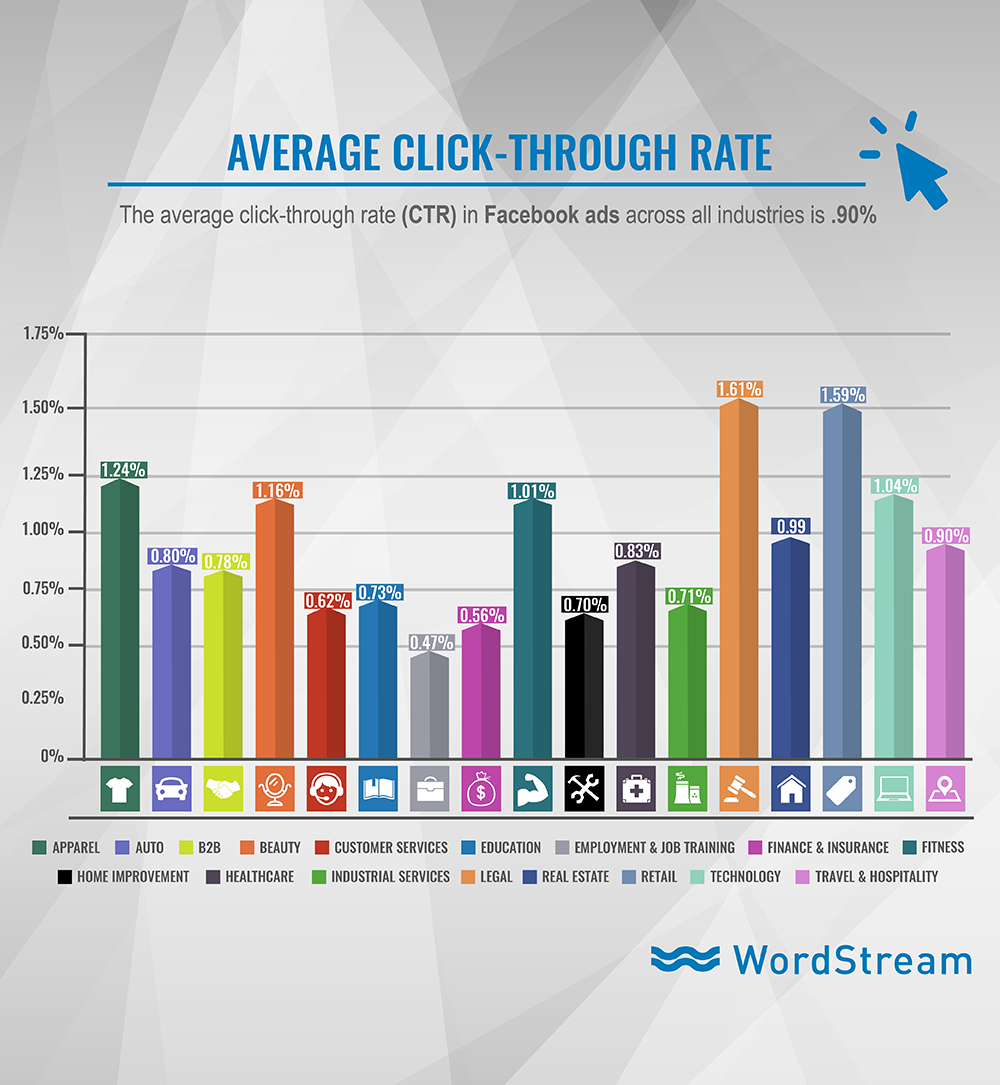
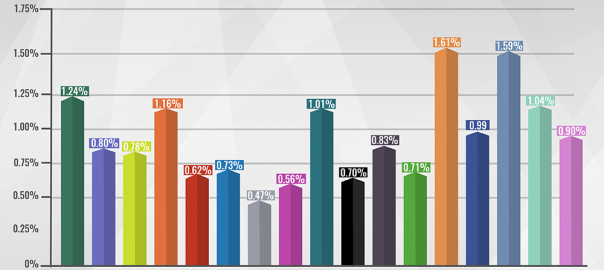
Legal advertisers may struggle with low click-through rates on the SERP, but they’re lucky to have the highest CTRs on Facebook (1.61%). No doubt, it can be hard to impress the prospective client looking for a lawyer when your ad is one among seven ads on the SERP, but a lawyer’s high-value offer and call to action certainly stands out more when it’s standing alone on a prospect’s social feed.
Other advertisers with high CTRs are in the retail (1.59%), apparel (1.24%), beauty (1.16%), and fitness (1.01%) industries. It’s no surprise that these industries often feature models and high-quality images in their ads, and those ads perform particularly well on highly visual platforms like Facebook and Instagram.
You have to be pretty crafty to distract potential job hunters from their social feeds, and employment & job training services can have relatively low CTRs on Facebook (0.47%). Facebook and Instagram may not be the network for job seekers, but LinkedIn may have promise for these advertisers!
The average click-through rate (CTR) for Facebook ads across all industries is 0.90%.
Average Cost Per Click (CPC) on Facebook
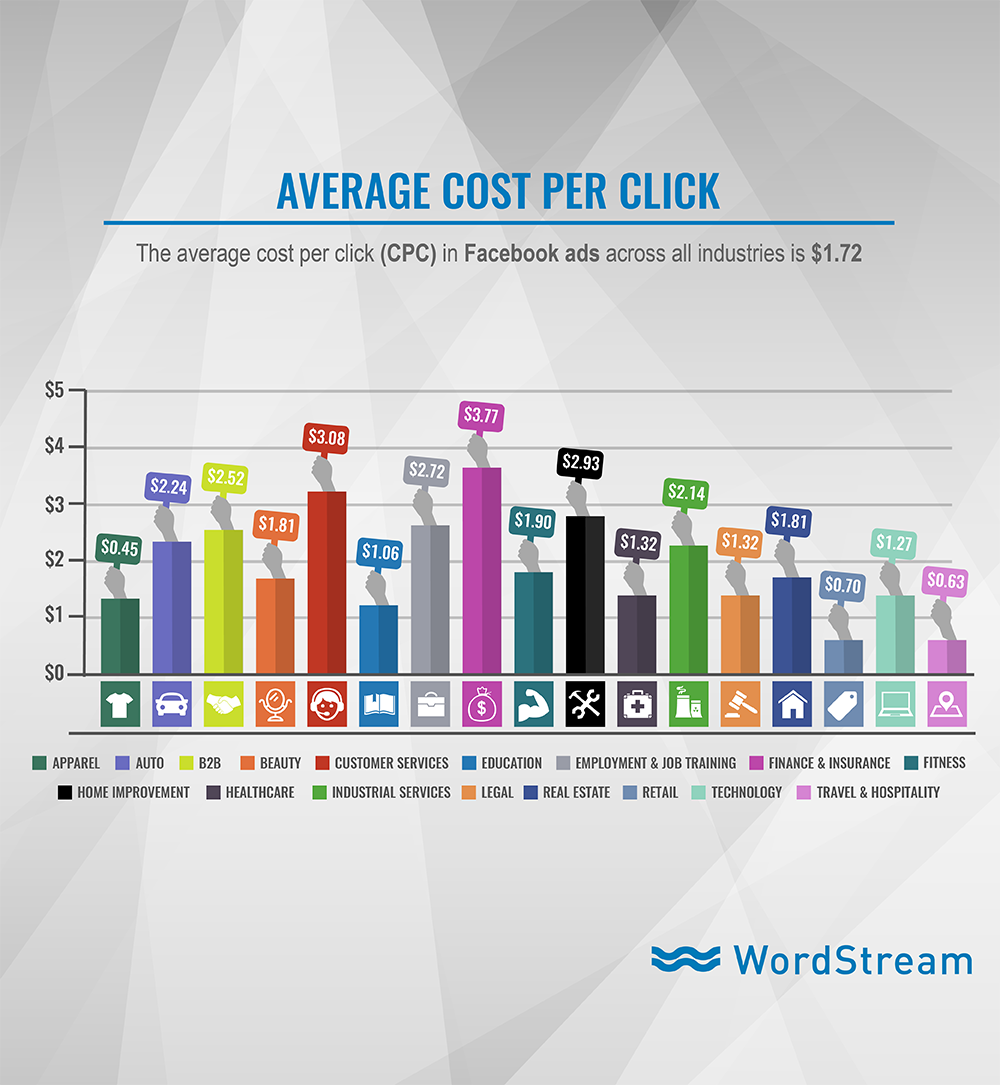
Even though financial advertisers have the highest CPCs on Facebook at $ 3.77 per click, advertisers may still be quite satisfied with that CPC on Facebook. The terms “Insurance,” “Loans,” and “Mortgage” are the three most expensive keywords on Google, each costing about $ 50 per click.
The cheapest clicks on Facebook are reserved for the apparel ($ 0.45 per click), travel and hospitality ($ 0.63) and other retailers ($ 0.70) industries, with clicks well below a dollar. These industries often have the largest audiences so even at these low CPCs, it’s important to understand how to manage your budgets so that your Facebook costs don’t run amok.
The average cost per click (CPC) for Facebook ads across all industries is $ 1.72.
Average Conversion Rates on Facebook
Fitness studios have plenty to sweat about, but finding prospects on Facebook doesn’t appear to be one of them! Facebook can connect driven prospects into the hands of fitness advertisers and help them convert at remarkably high rates, averaging 14.29% conversion rates from Facebook ads.
Other industries with high CVRs are education (13.58%), employment & job training (11.73%), healthcare (11.00%), real estate (10.68%) and B2B (10.63%). Facebook’s unique lead generation ads help these industries outperform most other ad platforms!
However, industries such as retail, travel & hospitality, and technology may not benefit as much from Facebook’s lead generation ads and consequently have much lower conversion rates (3.26%, 2.82%, and 2.31%, respectively). For these advertisers, remarketing on Facebook may be particularly powerful to help improve conversion rates. As it turns out, exposure to remarketing ads can help increase conversion rates over time!
The average conversion rate for Facebook ads across all industries is 9.21%.
Average Cost Per Action on Facebook
With an average CPA of $ 7.85, nearly all education advertisers agree that it’s a smart decision to cater to Facebook and Instagram’s relatively young audience. While Facebook may be a great place to find your new students, it can be an expensive place to find a new car, architect, or IT specialist – average Facebook CPAs for auto, home improvement, and technology services are $ 43.84, $ 44.66, and $ 55.21, respectively. Of course, the lifetime value of a new client in these industries is very high, making it all worthwhile in the end.
The average cost per action (CPA) for Facebook ads across all industries is $ 18.68.
What Does It All Mean?
Facebook advertising is really taking off because it offers an abundance of opportunity for advertisers of nearly all industries.
If you find yourself on the lower end of these numbers, that just means there’s plenty of room for improvement! To learn how to improve your ads on Facebook, visit PPC University or call us to speak with a Facebook expert today. If you’re hitting these benchmarks – don’t stop and settle for average either!
Check out the full infographic below:
Data Sources
This report is based on a sample of 256 US-based WordStream client accounts in all verticals (representing $ 553,000 in aggregate Facebook spend) who were advertising on Facebook between November 2016 and January 2017. Facebook campaigns can have several different objectives, so only Facebook campaigns with the objective of driving conversions were considered when determining average CVR and CPA numbers. Average figures are median figures to account for outliers. All currency values are posted in USD.
Digital & Social Articles on Business 2 Community(138)