Forbes proclaimed 2014 the Year of Digital Marketing Analytics, summing up the problem this way:
If most digital marketing programs or campaigns have a weak area, it’s analytics. One recent study identified that the biggest talent and hiring gap in online marketing is in the analytics space. 37% of companies surveyed said that they desperately needed staff with serious data chops.
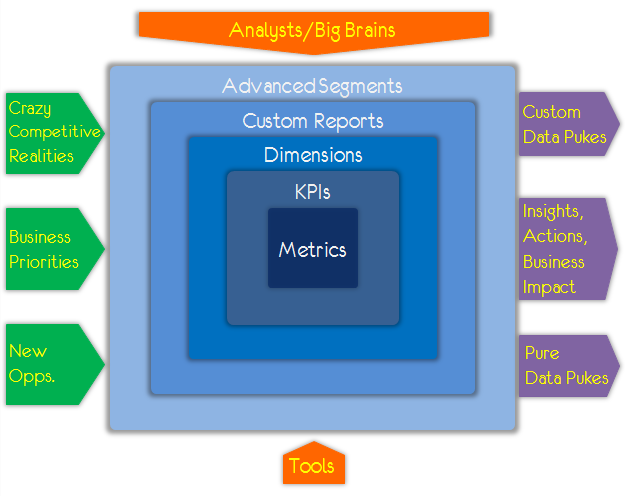
If you take a look at the image above, courtesy of Avinash Kaushik on Occam’s Razor, you’ll see a similar emphasis on “Big brains” and there just aren’t enough of them going around.
The state of digital marketing analytics today
Well, in 2015 we still find too few analysts trained in digital marketing analytics, especially when it comes to more advanced analytics. What passes for digital marketing analytics is also pretty dismal, amounting to little more than rudimentary vanity metrics.
If you look at interest in digital marketing analytics over time, you find the term first appeared in search in 2011, but searches exploded in 2013. Google forecasts continued steep growth in searches for digital marketing analytics based on the graph below from Google Trends.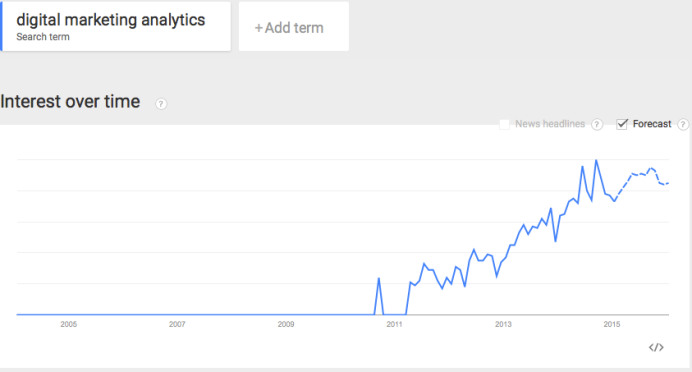
So, what do these searches turn up?
A ton of tools, many of which aren’t really analytics tools, but automation tools with a little tracking. For instance, I love SproutSocial for helping share and curate content, but it’s not really an analytics tool. Here’s what you get:
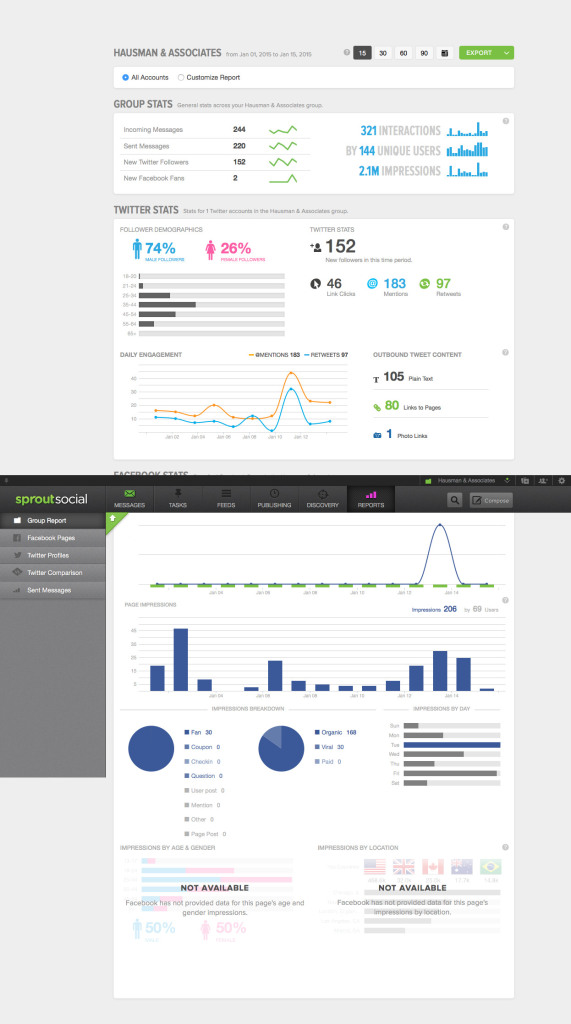
I ask you, how does this data help manage your digital marketing? What insights does it provide?
The same goes for many “analytics” tools provided by the social networks, which are pitifully anemic. A couple of caveats here, however. Google Analytics and Facebook Ads Manager provide very useful, insightful data to help optimize your digital marketing results. I’ve provided detailed directions for setting up and interpreting data from Google Analytics and Facebook’s Ads Manager.
What you need to rock digital marketing analytics?
Surprisingly, the first step is to gain an appreciation of analytics. I find many small and mid-sized companies don’t appreciate how critical digital marketing analytics are for their success. Even some large businesses don’t really get the importance of digital marketing analytics and focus too much on late funnel assessment rather than top of funnel assessments.
Recognize that digital marketing analytics require a budget. Too many businesses try to go cheap here with the notion that money is better spent on other activities. And, in the short run that might be true. Unfortunately, what you’re not seeing in this cost strategy is the opportunity cost of sales you didn’t make because your efforts weren’t optimized. I call this a penny-wise and pound foolish strategy because you’re saving a little money up front to lose a lot of money on the back-end.
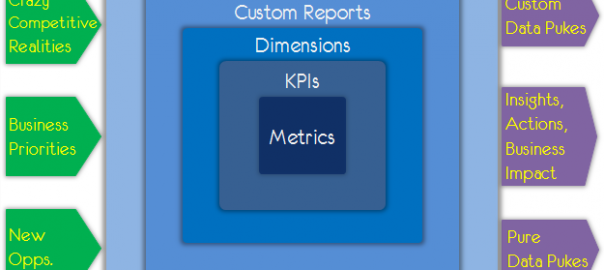
 KPIs and ratios
Next, you need to build KPIs (Key Performance Indicators) and metrics from your mission and strategy, focusing on both top of funnel (consumer sentiment, reach, engagement) and bottom of funnel (ROI, conversion, etc) strategies. This is why you need marketers schooled in digital marketing analytics — they understand marketing KPIs.
Set realistic priorities because you can’t focus on every possible KPI at the same time. I recommend selecting a balance between the KPIs at the top, middle, and bottom of the funnel that have the greatest impact on market performance.
Setting goals for these KPIs allows you to develop more meaningful metrics like ratios of expected versus actual. Large ratios demand investigation (and maybe testing to figure out why the ratio was large) while small ratios indicate you met expectations.
Level of analysis
Also, think about level of analysis issues — you want both overviews of how well your strategy is working and insights into segments, such as different social platform performance, performance of different types of content, etc. As an analyst, think about what different users need in terms of level of analysis. For instance, the VP marketing needs an overview, but she might want to deep dive into why some KPIs had high ratios. Meanwhile, your brand managers want to understand the performance of their products and community managers the performance of individual pieces of content. These elements fit within Kaushik’s notion of dimensions that covers performance of individual keywords, campaigns, posts, referring sites, countries, types of visitor, etc.
Data visualization
Visualizing data is critical for easing interpretation. In his TED talk, David McCandless, said this about the importance of data visualization:
By visualizing information, we turn it into a landscape that you can explore with your eyes, a sort of information map. And when you’re lost in information, an information map is kind of useful.
Data visualization not only acts as a short cut for interpreting data, the human eye sees pictures a whole lot better than numbers. Thus, appropriate visualizations allow managers to identify problems quickly so they can fix the problem before it becomes a crisis.
For instance, P&G monitors deliveries using GPS installed in its fleet of trucks using colored digital block — each block representing the value of the customer to P&G and the color representing expected delivery (green for on time, yellow for possible delays, and red for likely delays). When a truck runs into problems (traffic, weather) that threaten delay to a major customer (like Wal-Mart), managers can quickly send replacement shipments from a local distribution center or re-direct shipments from less critical customers or shipments with sufficient lead time.
Translating digital marketing analytics into action
Unfortunately, many firms find their digital marketing analytics programs falling down at this critical step — translating insights into action. In this article, Google quotes poet, Andrew Lang who eloquently said:
He uses statistics as a drunken man uses lampposts—for support rather than illumination
Translating insights into action often means going back to manipulate your data for more nuanced insights;
- looking for relationships among your data – for instance, you might uncover a relationship between top performing posts and specific keywords used or publication timing
- looking at trends rather than data points – trends often help you identify meaning in your data such as cyclical trends or when a particular data point stands out from others versus simply representing normal fluctuation
- turn data into predictive models – don’t stop with viewing data as isolated points and basing forecasts on simple linear extrapolations. Predictive models use historical data to determine the relationship among a set of factors and desired outcomes (like KPIs). Then analysts use these algorithms to predict future KPI performance. You can even play “what-if” games to determine the impact on performance of various actions. This helps determine which changes represent the greatest impact on performance.
- don’t forget that data analysis is part art and part science. Translating insights into action involves a certain amount of playfulness with the data to discover deeper insights.
(407)