")
7 Don’t-Miss Facts On Social Media 2014
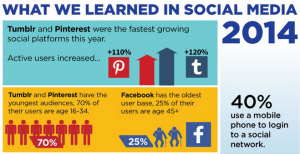
Looking for a short, sweet recap of a year in social media? This concise social media infographic from Didit assimilates the key points you need to know in order to understand the state of social media in 2014. As we look ahead to another year of growth and change, let’s reflect on where we’ve gone over the last few months…
#1 Four Out of Ten Users Access With Mobile
Mobile usage is continuing to climb. This year, 40 percent of social media users used a mobile device to log into a social network. Many people access social media networks exclusively on their mobile devices. This summer, for instance, Facebook reported that 30 percent of users access Facebook exclusively through their phones!
#2 Fastest Growing Networks: Tumblr & Pinterest
Tumblr and Pinterest grew their active user bases exceptionally well: +110% for Pinterest and +120% for Tumblr. Growth in these networks is indicative of an overall shift toward visual-based content around the web.
#3 Fastest Growth In Mobile: Snapchat
Speaking of visual content, SnapChat, which consists almost entirely of visual, user-generated content, experienced the fastest growth of any social network in the mobile space (56 percent). 71 percent of Snapchat users are under the age of 25.
#4 Age Gap: Tumblr/Pinterest v. Facebook
In 2014, Tumblr and Pinterest captivated the youngest audiences; 70 percent of these users are between the ages of 16 and 34. On the other end of the spectrum, Facebook has the oldest user base; one out of four are over the age of 45.
#5 Facebook Is #1, But Organic Reach Is Poor
While Facebook still stands as the #1 social media network of 2014 (based on global users), its organic reach is poor. I predict that more social media marketers will be looking at other networks when budgeting out their advertising dollars.
#6 YouTube Gets Most Visits
In 2014, YouTube was visited by 85% of all online users each month, giving the site the highest visitation rate of any social network. Users watched six billion hours of video per month and uploaded 100 hours of video every minute.
#7 Multi-Networking On the Rise
Perhaps the most important fact in Didit’s social media infographic is that multi-networking is flourishing. Nearly one in five social media users visit YouTube, Facebook, Twitter, and Google+ every single month. And nine out of ten adults (age 16-64) visit at least one of those sites on a monthly basis.
What Did You Notice About Social Media In 2014?
What do you think is the most essential piece of data presented in this infographic? What’s the one thing social media marketers have to understand in order to successfully transition into 2015? Jump in the comments section below to discuss!
![]()
Digital & Social Articles on Business 2 Community
(350)