It’s time to prepare for using Event-Based Analytics to evaluate the digital customer journey.
The transformation of how marketers need to approach analytics is underway. It is time to stop thinking about user flow and instead think of a series of events (tasks) that we expect from engaged users.
Long before the first web banner ad appeared (Oct. 27, 1994, in Wired magazine), marketers wanting to help their clients with their marketing efforts embraced the marriage of analytics and marketing. Over time, that marriage has evolved, and the capabilities of analytics tools have as well.
At one time, marketing reports were, “Look at the number of site visitors the campaign generated!” or “See how many page views we were able to get!” These were the common uses of analytics. Eventually, as analytics tools improved, the ability to attribute online sales to specific marketing efforts became possible.
During these 30-plus years, one thing remained constant in marketing’s interpretation of web-based analytics: A campaign drove X visitors to the site. They viewed so many pages, which led to a given number of sales. Essentially, a basic user flow. Each step on the site during the visitor’s journey was seen as fluid and easy to follow.
As marketers, we need to start getting our brains in shape for what is coming with the next generation of analytics tools and techniques. The new generation of analytics tools no longer process user activity recording (log file) but instead store specific events in a database. If you haven’t heard about “Event-Based Analytics,” you will soon hear about it everywhere.
Back in October 2020, Google released Google Analytics 4 (GA4). It was in Beta mode, but any user signing up for Google Analytics was automatically enrolled into GA4. You had to know your way around GA to set up the old Universal Analytics (UA). While GA might be the most popular analytics tool out there, Adobe Analytics has been doing “Event-Based Analytics” for a while, along with several other analytics tools out there.
While the official date by Google forcing everyone to switch over to GA4 hasn’t been announced, rest assured it is coming, and it is time to start thinking about “Event-Based Analytics,” and how it differs from what you are used to and some of the advantages contained within it.
Defining Event-Based Analytics
“Event-based analytics is the method of tracking and analyzing interactions between users and your product, also known as events.”
What does this all mean to marketers? We need to rethink how we present analytics data as part of our marketing reports.
In the past, when we’d talk about a user’s journey, say, “They came from this campaign, landed on this page, visited these pages and made a purchase of $ XXX.XX.”
With Event-Based Analytics, we’ll still see which campaigns brought visitors to the site. Following them on which pages they viewed is not as easy, but tracking the individual steps in the checkout process becomes much easier.
With Event-Based Analytics, we get a product view of what transpired more than user flow.
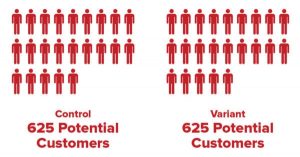
For example, we can create a segment for a specific campaign and see individual steps (think of it as stepping stones, a user can easily jump from one to the other or skip over some of them). In an e-commerce site, we’ll see how many units of each product were added to shopping carts and how many were purchased. You won’t see if they add a product to their shopping cart, then come back later and remove it or decrease the ordered amount. Event-Based Analytics will generate a report that looks something like this:

Event-Based Analytics and segmentation
A powerful feature that becomes available with Event-Based Analytics is enhanced segmentation. While order analytics tools offer some level of segmentation, you’ll now have much more flexibility when it comes to defining them. Segmentation will provide you with the ability to separate prospects and customers into specific groups based on how they engage with your product.
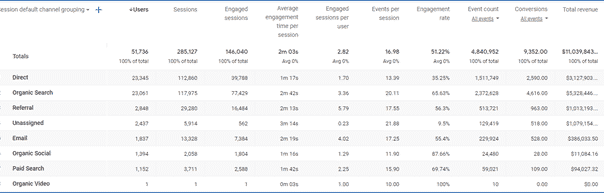
Below is an example of how with Event-Based Analytics user engagement by different channels of acquisition can be generated.

With Event-Based Analytics, you’ll most likely not see a bounce rate measurement being reported. Why? Because the simple act of viewing a page is an event. Most analytics tools now record time on page (an event is triggered every X seconds) via timers and not just from the timestamp between page views and they also will track user scroll on a page (engaging). To simplify this, if a user spends X seconds on a page or starts scrolling then they didn’t bounce, but they engaged. We now have to think of “engaged sessions” versus “non-engaged sessions”. A single page view, with no scrolling and spending less than X seconds is a “non-engaged session.”
Read next: What is customer journey analytics?
Using Event-Based Analytics to increase revenue
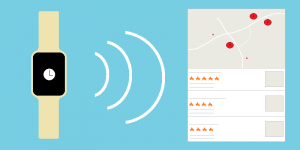
With an ecommerce website and mobile app, a site visitor (perhaps from a marketing campaign) opens the website and browses a number of items before adding an item to their cart. It could be days later, they log back in on the mobile app and complete the purchase. Now in your analytics platform, the above behaviors or events might look like this: “User Sign Up,” “Search for Items,” “View Item Details,” “Add Item to Cart,” and “Purchase Complete.” On many older analytics tools, you wouldn’t see this connected journey, but would see that a user came from X campaign, added items to the shopping cart, and then stopped. Another user “magically” logged in via the app but bought stuff without even adding them to the shopping cart.
Event-based data can generate questions that lead to product changes and adjustments. After reviewing data from the above example, we could be asking:
- The percentage of users that complete the checkout in a single session?
- Does conversion differ by item or brand?
- If users didn’t convert, where did they do? (abandoned the site, continue to view other information, etc.)
- How long does it take (in minutes or days) for conversion?
- Do users face a payment error or other issues (events) during the checkout process?
- If they didn’t purchase immediately, are they gone forever?
You might be able to answer the above questions with your existing analytics tools, but with event-based analytics it becomes much easier.
Event-Based Analytics and data warehousing
Combining your Event-Based Analytics data with a data warehouse puts your data on steroids. You may have noticed that each event is essentially a data point that can easily be exported to a data warehouse.
Simply by exporting your data, you now have the power to manipulate and process your raw data. Previously, you had to work with the data available within your analytics tool.
For example, with an e-commerce site, you are likely tracking a unique customer ID. This by law is an anonymous ID (no way to link to specific personally identifiable information). Within your database, you can execute a customer lookup and start to see how much specific customers are ordering and when. How about generating a report of customers who left items in their shopping cart for more than 2 weeks? As a marketer, you could then generate incentive based emails, or even have their assigned sales rep give them a call to see what’s up. It is in this power of the combined data in the data warehouse that truly allows event-based analytics to drive up sales.
Reporting is further enhanced and made easier using your data visualization tools when accessing the data warehouse. You no longer need to connect multiple data sources and show individual reports. Connecting your data visualization tool to the data warehouse, allows data to be presented in unified tables and graphs.
If your organization hasn’t already implemented event-based analytics, start making plans to do so. If you’re currently running Google’s Universal Analytics (UA), start preparing for when they announce the date for turning off UA and forcing you to switch to GA4. As a recommendation to all UA users, it is time to start running GA4 in parallel, if for no other reason, to familiarize yourself with it and to start seeing the power that it brings with it.
The post The evolution of digital analytics and marketing appeared first on MarTech.
(32)