At SMX East 2018 in New York City Jenny Halasz and Simon Poulton shared their best tips for two approaches to upping your analytics game. Here is a brief summary of their main points. You’ll also find links to their presentation decks to learn more.

In May 2016, Google unveiled Data Studio, a free data visualization tool that allows anyone to create reports with graphs, charts, tables, and other elements that automatically grab data from a variety of sources.
Tips and tricks to get started with Google Data Studio
Jenny Halasz – President, JHL Marketing. Twitter: @jennyhalasz
Jenny Halasz presented an introduction to using Data Studio, along with many useful tips, tricks, and hacks to make it even more powerful and easy to use.
Jenny began by pointing out that Data Studio was rolled out as a much more user-friendly alternative to the (now deprecated) Google Dashboards. In addition, Data Studio now supports connections to over 90 data sources. There are better tools for data visualization than Data Studio, but it’s free and relatively easy to use, so for most purposes, it will do the job.
Some Data Studio terminology
Knowing what the terms below mean in Data Studio will save you a lot of pain during your initial setup:
- Data connectors: The connection between a data source (such as Google Analytics) and a Data Studio report.
- Segments vs Filters: A subset of data in Google Analytics (GA). Segments can only be created in GA, but you can use them through a data connector in Data Studio. A filter includes or excludes specific portions of data from a source or a segment. Filters are created in Data Studio and act on the data after it reaches Data Studio. (They do not change anything in the original data source). For example, you could create a filter to exclude all sessions below a certain number.
- Metrics: In Data Studio, a metric defines the specific thing you want to measure. For example, “sessions” could be a metric.
- Dimensions: Containers you put the metrics in. For example, you might want to look at the metric “sessions” broken down by the dimension “medium.”
- Goals: Specific actions or engagements you want to track. Goals must be set up in Google Analytics, but can be used in Data Studio.
Getting started with Data Studio
Log in to your Google account and go to Data Studio and start a new report. PRO TIP: for a quick start use one of the many templates provided, which can be fully customized. Also use Google’s sample data to make sure your reports work right before connecting your own data.
The first data sources you should add are Google Analytics and Search Console (the latter if you are creating an SEO report). HINT: You have to scroll way down the list of sources to find those!
Once you select a data source you’ll be taken to a screen where you select some specifics for that source. For Google Analytics, each report must be linked to a specific account, property, and view.

When you’re in a report and create an element (a table, graph, chart, etc.), you can select what metric it displays using the Metric Picker in the right sidebar. Also, use this to change the metric of an existing chart.
The next thing to expose is filters. Filters are powerful because they let you include or exclude data parameters from a source in between the source and your report. So you aren’t stuck with the raw data coming from the source if it contains noise you don’t need
You can also change the style of any element by selecting it in edit mode and then clicking the style tab in the right sidebar.
Some tips and tricks
Jenny shared some things you might overlook but which can vastly improve your reports.
- In the styles tab, you can change the axis of a graph if the wrong one is showing.
- Uncheck row numbers in styles for tables if you don’t need them.
- If all else fails, create a white text box to cover anything you don’t want!
- To automatically align elements, select multiple elements, right click, and select align.
- You can even create sticky notes to add explanations to your data displays. IMPORTANT: Give your custom metrics and filters unique descriptive names.
Blending data
Data blending is a relatively new feature in Data Studio. It allows you to bring in data from more than one source and place it in the same chart or graph. To create blended data, go to Resources, then to “Manage blended data” and “Add a data view.” The example below shows selected metrics from two different sources to create a year-over-year graph.

Some rules for blending data:
• You must have a join key (a metric that is the same in both sources)
• You can not filter blended data
• You can not change dates on blended data
Some problems with Data Studio
As powerful and easy to use as Data Studio is, it still has some issues and some areas for needed improvement. These include:
• No auto-emailing function to send scheduled reports
• Reports can’t be exported as PDF
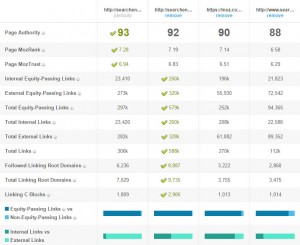
• There are still not connectors for some major tools such as SEMRush and SearchMetrics
• Google Search Console connections are limited to URL and query data
• No template link creator to easily share templates you’ve crated
• The blended data function is too limited.
See the full slideshow presentation from SMX here.
Metrics for profitable growth
Simon Poulton – Senior Director of Digital Intelligence, Wpromote. Twitter: @spoulton
Simon Poulton gave us an advanced look at a type of analysis he thinks too few marketers use: measuring the profitability of marketing campaigns. He noted that delayed gratification is a challenge for marketers under pressure to show short-term results. However, optimizing for profitability is the surest path to long-term growth.
In 2014 the Think with Google blog published a post by Matt Lawson titled “The Profit-Driven Marketer.” Some of his main selling points for marketers to be more driven by profitability included:
• Moving from reactive to proactive. The more assurance you have about the future the better decision you can make in the present.
• The ability to better predict customer lifetime value, allowing more concentration of resources on the most profitable customers.
• Allowing KPIs to evolve into higher forms. Clicks and conversions are fine starting metrics, but revenue, gross profit, and lifetime value yield far more useful information.
Using the formula Growth = Acquisition + Churn gives you a sense of how confident you can be that customers will return for another purchase.

Peter Fader promoted what he called the “Buy ’Til You Die Model.” He was interested in the probability that a given customer would still be a customer within a twelve-month window. Use this information to create a hierarchy of customers so you put the most resources toward your elite customers.
Simon also recommended an article on how to calculate and leverage LTV.

Profit-centric analytics
Simon then moved into how to set up your analytics to measure profitability at a product SKU level. This involves importing the Cost of Goods Sold (COGS) including any media costs into analytics so actual profit vs. revenue can be measured.
Take a competitive approach to profit and find that sweet spot where profits are maximized as compared to your investment. As you see in the graph below, most companies stop when revenues start to level off, but the actual target of maximum profit may be further on.

Essential to optimizing marketing for profitability is knowing the COGS and being able to import it into Google Analytics. Simon shared an example of a GA custom metric to do this.

Next, include this custom metric as a variable within your purchase dataLayer.

Now create a lookup table with the COGS associated with each product SKU. This could also be done at a product category level.

Reference the lookup table for COGS to push it into the Purchase dataLayer.

Now call back the values via a Google Sheet.

Your purchase dataLayer should now look something like this.

Now create a calculated metric for COG-adjusted revenue.

Now you can see a column for COG Adjusted Revenue in your Google Analytics product dimension.

To get true profitability by SKU, you should also import media costs (such as CPC). For the steps to do this, see Simon’s SMX East slide deck, slides 31-33.
Once all this is in place, you can calculate actual profit: Product Revenue – (COG + Media Cost) = Profit.
Profit-centric analysis and strategy
It’s a good idea to create a profit dashboard (Data Studio, importing profit data from Google Analytics would be an excellent tool for this). Such an overview can enable better decisions making. You’ll be better able to answer questions such as how much you should invest in:
? new customer acquisition
? existing customer retention
Other questions you can answer knowing the actual profitability of sales:
- How often should we run promotions and what can we offer?
- Which products should we focus on for:
- profitability?
- growth?
- best customers?
See the full slideshow presentation from SMX here.
Opinions expressed in this article are those of the guest author and not necessarily Marketing Land. Staff authors are listed here.
About The Author

Mark Traphagen is Content Strategy Director for Perficient Digital (formerly Stone Temple Consulting). His primary responsibility is building the online reputation of the brand while testing strategies and tactics that will benefit his agency’s clients. Mark writes for numerous top industry publications and is a regular speaker at SMX events and other national marketing conferences.
Marketing Land – Internet Marketing News, Strategies & Tips
(63)