More than one billion people worldwide use Instagram, and active users spend an average of 28 minutes each day scrolling through the app.
The numbers say it all. There’s no shortage of opportunities to reach your target market. The challenge lies in cutting through the noise, driving engagement, and transforming your followers into loyal customers.
Instagram analytics – or Insights, as the app calls it – is your secret weapon. With an informed and proactive approach, you can leverage Insights to make data-backed decisions that optimise your Instagram strategy and boost ROI.
This is your comprehensive Instagram analytics guide. Learn how to access Insights, what different metrics mean, and critically, how to best act on the data at your fingertips.
The huge 2021 guide to Instagram analytics starts now.
Why do Instagram analytics matter?
Let’s say you’re on a road trip in an unfamiliar land. You’re racing to your next destination. Do you:
- Use a map to guide you?
- Guess and hope for the best?
You likely went with option 1, and for a good reason. Navigating through unknown territory without a map (or Siri) is a recipe for a missed dinner reservation and frantic phone calls to your hotel’s concierge.
Now, back to Instagram. Think of your goal on Instagram as a destination. You need a map to get there, and Instagram analytics is precisely that. It tells you who your audience is, what type of content they prefer, and even what time of day they are most active.
Use this data to shape your Instagram strategy, and you are well on your way to reaching your goals. There are, however, a few caveats.
First, Instagram analytics only matter if you know what you want to achieve with Instagram. A map is more or less useless if you don’t have any idea where you would like to go.
So, before you jump into actioning insights gained from Instagram analytics, get clear on your goals. Do you want to increase brand awareness? Reach a new target market? Rebrand your business? Or sell more products?
You might have one clear objective or several. Either way, take the time to envisage what Instagram success might look like to you and your business.
Second, Instagram analytics is only effective if you allow the numbers to gently shape your content strategy. If Siri tells you to make a left turn, don’t turn right! But if you spot a breathtaking view, it’s quite alright to pull over and admire the scenery.
Remember, you are (probably) not your target audience, so don’t allow your personal preferences to influence the style of content your brand publishes. Listen to the data, trust it, allow it to define your approach, but leave room for spontaneity.
How to view Instagram analytics
You must have a business or creator profile to access Instagram analytics. If you haven’t yet made the switch, check out our instructions here. Business profiles offer a whole host of features beyond Insights, too.
Otherwise, you’re ready to dive head-first into the wonderful world of Insights. Simply navigate to your profile and tap on the burger menu icon in the top-right corner of your screen. Select Insights.

After opening Insights, you’ll be bombarded with numbers and metrics from the previous seven days – let’s break it down:
- Recent highlights
- Below this header, you’ll see the number of followers you gained or lost over the last seven days
- Overview
- Accounts reached
- Content interactions
- Total followers
- Number of posts
- Number of Stories
- Number of IGTV videos
- Promotions
A quick note: If you’ve just made the switch to a business or creator profile, you won’t see any analytics for content published beforehand. Instagram can only give you metrics relating to content published from business or creator accounts.
Tap on any of the sections listed above, and you can dig even deeper. If you want, you can adjust the seven-day time period to 30-days in the top-left corner.
You can also access post-specific analytics by tapping on a post in your grid and selecting “View Insights” right below the image, to the left of the big “Promote” button.
This will show you the following metrics:
- Likes
- Comments
- Shares
- Saves
- Profile visits from the post
- Reach
- Interactions such as profile visits or, if it’s a sponsored post with a link, clicks
- Discovery, which includes insights that detail how many people see your content and where:
- Accounts reached
- Per cent of accounts reached that weren’t following your account
- New follows
- Total reach
- Impressions and where these impressions took place: from home, Explore, hashtags, and other
And finally, if you’re using Insights on the go and need a little guidance, you have access to a quick and easy Instagram analytics guide in the app itself. Tap the information icon (which looks like an italicises ‘i’) in the top-right corner of your screen.
That’s the basics. Now, the details.
Instagram analytics: Accounts reached
What it is
Accounts reached tells you how many unique Instagram accounts your content has landed in front of in the past seven or 30 days, depending on which time period you have selected.
Keep in mind that this is not the same as impressions – one account might see your post five times, adding +1 to your accounts reached metric and +5 to your impressions metric.
What you’ll see
First, you’ll see the total number of accounts reached on Instagram for the time period selected. Below, you’ll get a percentage that compares the current period’s performance with the last period’s performance.
Then, you’ll see a graph that details the number of accounts reached each day. Most likely, your reach will vary significantly day-by-day – even if you post daily.
Below the graph, you’ll see the number of impressions and the percentage of change from the last period.
Notice how impressions are significantly higher than accounts reached?

In the screenshot above, the profile has about ten times more impressions than accounts reached, which tells us that each account is seeing published content about ten times.
Next up is your account activity. These insights measure the actions that took place on your account, not including engagement with your content.
You’ll see the following:
- Profile visits
- Website taps, if you have your website (or any link, for that matter) listed in your bio
- Get direction taps, if you have your address listed in your bio
- Call button taps, if you have your phone number listed in your bio
- Email button taps, if you have your email address listed in your bio
- Text button taps, if you’ve enabled this feature with your phone number
Finally, you’ll see your top posts, Stories, and IGTV videos based on reach. Tap “See All” beside each heading to view all of your content organised by reach.
We won’t dig into this section here. But if you can’t wait, jump ahead to Content you shared below.
Why it matters
Reach is a vital metric to track because it can help you answer some of Instagram’s most pressing questions:
- Which types of content are most popular with your target audience?
- Which types of content are most likely to result in your target audience taking action?
- How can you get your brand’s content in front of more people?
Here’s how you can find answers.
Which types of content are most popular with your target audience?
The graph allows you to pinpoint activities that resulted in increased reach quickly. For example, if you see a spike in reach every Saturday, you can deduce that your target audience is active (or more prone to engagement) on Saturdays. If you tried sharing user-generated content on Tuesday, check back the following Monday and see what effect this new strategy had on reach – did you notice an increased, decreased, or average reach?
While it’s not an exact science, you can generally assume that more engagement equals more reach. Engagement tells Instagram that your content is relevant, valuable, or entertaining – people like it, and Instagram wants people to enjoy their experience. So, the platform shows your content to more users, and that means greater reach.
Which types of content are most likely to result in your target audience taking action?
You cannot add a clickable link to your organic Instagram posts, but you can convert your audience in different ways. The account activity section can help you shape a strategy that successfully levels up Instagram browsers.
For example, say you want more Instagram users converted into website visitors. You experiment by adding, “Click the link in bio to learn more” to your posts’ captions for one week. Now, you can visit the account activity section and determine whether this call-to-action influenced your followers’ behaviour.
How can you get your brand’s content in front of more people?
Most businesses on Instagram want their content in front of as many people as possible. Reach is the best way to determine how to make that goal a reality.
First, select a reach strategy that resonates with your brand, such as:
- Experimenting with popular hashtags
- Tagging people or brands in your posts
- Encouraging engagement (and therefore reach) by asking questions in your captions
Then, experiment with the strategy for one week. Revisit your reach insights. If reach is up on last period, your experiment may have proved successful.
Instagram analytics: Content interactions
What it is
Content interactions tell you how many times your followers and other Instagram users engaged with your content. These insights measure interactions with posts, Stories, IGTV videos, and Reels.
What you’ll see
First, you’ll see the total number of interactions for the time period selected. You’ll then see a percentage that compares the current periods with the last period’s interactions.

Then, you’ll see the total number of post interactions, followed by a breakdown detailing different interaction types:
- Likes
- Comments
- Saves
- Shares
Next up, Stories. You’ll see the total number of Story interactions, plus the number of replies and shares.
You’ll then see the total number of IGTV video interactions.
Finally, you’ll see your top posts, Stories, and IGTVs based on interactions. Tap “See All” beside each heading to view all of your content organised by interaction.
Why it matters
If reach measures quantity, interactions measure quality. Your posts might reach 10 million users, but if they aren’t engaging with your content, what’s the point? Tracking interactions should be a mainstay in your ongoing content optimisation strategy because it’s engagement that unlocks Instagram’s full potential.
It’s called social media for a reason – Instagram marketing is about forming a genuine connection with your audience, and that demands conversation. The conversation might be literal – encouraging and replying to user comments – or representative – positive feedback in the form of likes.
So, what should you do with your interaction data? Unpack the numbers to uncover what’s relevant to your audience. Here are several ways to get started:
- Experiment with different post types and measure your results. Does your audience engage more with photos or videos, for example?
- Categorise your imagery to determine what, precisely, resonates. Does scenery encourage likes? Maybe it’s photos of your team, before and afters, or inspirational quotes that perform best. Focus on colours, too.
- Play around with your captions. Do questions, prompts, and other call-to-actions improve engagement? Are short or long captions better at kick-starting a conversation in the comments section?
- Try adding text to your Stories. Does asking questions increase the number of replies?
The more you stay in-tune with your interaction metrics, the more you can optimise your content for engagement. The more engagement you can win, the more genuine, growth-driving, revenue-boosting value you can squeeze out of Instagram.
Instagram analytics: Your audience
What it is
Audience insights measure follower growth and provide a comprehensive breakdown of your followers’ demographics, including location, age, gender, and most active times.
What you’ll see
First, you’ll see the total number of followers and the percentage by which your follower count has changed over the selected period.

Then, you’ll see a breakdown of your account’s growth, including the overall growth, number of follows, and number of unfollows. Below, these figures are expressed visually in a graph. Tap the graph to see the follow and unfollow metrics plotted.
Next, you’ll see your followers’ top locations. You can view top cities or top countries.
After, you’ll see your followers’ age ranges expressed as a percentage of your total followers. You can view the overall age ranges, as well as the age ranges for men and women.
Then, you’ll see a pie chart detailing your followers’ gender breakdown.

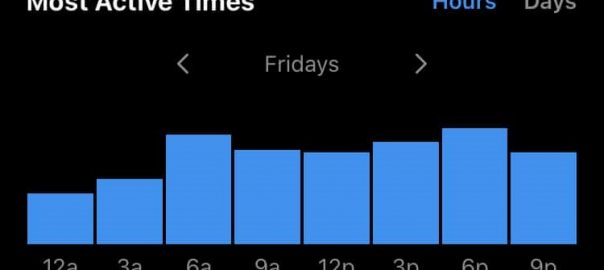
Finally, you’ll see your followers’ most active times. You can select “Hours” or “Days.”
Why it matters
Here’s how you can incorporate each section of your audience insights into your Instagram strategy, starting with the growth metrics.
Growth metrics
Overall growth is a big-picture benchmarking tool you can use to better understand what is and isn’t working for your account. As you tweak your content strategy, be sure to check how adjustments impact your growth rate.
For example, if you start using Instagram Reels and notice a significant jump in new followers, you know that your Reels content is engaging and worthwhile. You can use this information to enhance your future strategy.
A quick note: Unfortunately, Instagram doesn’t show you your account’s growth over time periods greater than 30 days, so you may want to record it in a spreadsheet.
Audience demographics
The more you understand who your audience members are, the better you position yourself to create content that appeals to them.
You can use your organic followers’ demographics to inform your promotion strategies. For example, if most of your followers are women aged 25-34, you don’t want to waste your advertising budget on men aged 45-54.
Instagram’s demographic metrics are also applicable to other marketing channels. If your brand is already thriving on Instagram, you can use audience demographics to inform Facebook ads, email campaigns, and blogging strategies.
It’s worth noting that these kinds of audience demographics shape a one-dimensional view of your ideal customers. How old they are and where they live is a start, but it’s worth extrapolating further to build out a flesh-and-blood picture.
If you know your audience is in their mid-20s, what does that tell you about their values? What motivates them? What do they care about?
Use demographics to create three-dimensional personas with wants, needs, and challenges, and consider how your product or service feeds their wants, reliably meets their needs, and overcomes their challenges.
Most active times
Leveraging your audience’s most active times to refine your posting strategy delivers one of the quickest wins in this Instagram analytics guide. It’s easy and just about fool-proof.
When your followers are active on Instagram, publishing content will give your posts, Stories, IGTV videos, and Reels the best chance of being seen and engaged with. More engagement broadens your reach, and greater reach means more brand awareness and opportunity for growth.
Also, consider the relationship between content and time; think about what your audience is doing while scrolling through Instagram. If it’s 6.30 am on a Monday morning, and they are sitting on a busy train exhausted, they aren’t likely to respond positively to challenging or corporate-style content. They want easy. They want escapism.
Similarly, if it’s Friday afternoon and you spot an uptick in audience activity, that could be the perfect time to remind your followers about your weekend brekkie special.
Instagram analytics: Content you shared
What it is
The content sections of Instagram’s Insights allow you to view top-performing posts, Stories, IGTV videos, and promotions. You can sort and filter content by type and interaction to align your content strategy with your overarching Instagram goals.
What you’ll see
When you tap on “Posts,” you’ll see a grid of the content you’ve published to your feed within a given time period, sorted by a selected interaction type.
Three menus at the top of the screen allow you to filter and refine your results by the following:
- Post type: any, photos, videos, and carousel posts
- Metric: call button taps, comments, email button taps, follows, get directions taps, impressions, likes, post interactions, profile visits, reach, saves, shares, text button taps, video views, and website taps
- Time period: seven days, 30 days, three months, six months, one year, and two years
When you tap on “Stories,” you’ll see a similar grid of the Stories you’ve posted within a given time period, sorted by a selected interaction type.
Two menus at the top of the screen allow you to filter and refine your results. You can select from a series of Stories-specific metrics – like next story, exits, and replies – and time periods – although you can only choose from seven, 14, and 30 days.
Tap on “IGTV videos” or “Reels” for a similar view with content type-specific metrics.
Why it matters
Content metrics help you craft posts, Stories, Reels, IGTV videos, and ads that increase your brand’s visibility, drive engagement, and convert Instagram users into real-life customers. It also helps you understand what types of content are more likely to result in meaningful follower activities.
Crucially, by sorting by interaction type, you can discover the types of content that best achieve specific goals. This empowers you to align your content creation strategy to bigger-picture business outcomes.
For example, if your goal is to increase brand awareness, sort posts by reach. What do posts with the highest reach have in common? Equally as importantly, what do the posts with the lowest reach have in common?
Another example: let’s say you want to encourage your Instagram followers to read the blog posts you publish weekly. Sort posts and Stories by website clicks. What subject matter encourages the most web visits? What call to action drives the most interest? Even things like colour scheme can impact whether a user taps through to your profile and on to your website.
Finally, you can use content insights to inform your promotions. For example, if you sell clothing, determine whether organic posts featuring clothing on a model in a studio perform better than those featuring clothing on a real customer in a real setting. Then, use this information to design, plan, and publish high-impact promotions that cater to your audience’s preferences.
Other Instagram analytics
Any business using Instagram can utilise the above insights to enhance its content creation and growth strategy. Two other sources of analytics – Instagram Shopping and Instagram Live – are a little more niche. If you take advantage of these features, the following analytics tips will give you a leg up.
Instagram Shopping analytics
If you tag products in your posts using Instagram’s Shopping feature (you must have a business account to use this feature), keep track of which posts and products drive the highest ROI.
To see how your shopping posts perform, make your way to the “Content You Shared” section of Insights. Tap posts or Stories and use the menus to sort your content by shopping-specific metrics. You will only see these options if your account has Instagram Checkout enabled.
Alternatively, tap “View Insights” beneath any shoppable post to view post-specific shopping metrics. Two notable mentions are product button clicks and product page views.
Keep an eye out for products with a high number of page views but a low number of clicks. This suggests your product images, description, or pricing isn’t quite persuasive enough to convert browsers into buyers. Change things up and check back to see if the conversion rate has improved.
Instagram Live analytics
Live analytics are not visible fromInstagram Insights, and viewing actionable data relating to Live broadcasts isn’t all that easy. You can see how many people in total watched your Live, but this view count will disappear as soon as you end your broadcast.
If you use Live regularly, be sure to note the time and number of viewers, so you can track your own metrics and optimise your approach.
Balancing analytics with spontaneity
Data doesn’t exist in a vacuum, and it’s crucial to recognise the dependencies between various Instagram metrics. More engagement generates more reach; more reach, in turn, generates more engagement. Similarly, optimising post times boosts reach, and curating the look of your posts and feel of your captions drives likes, comments, and shares.
Using analytics to optimise your Instagram strategy involves (not quite scientific) experimentation. You view the data, formulate a hypothesis, run your experiment, and measure your results. And while these results might uncover invaluable insights about your audience’s preferences and behaviours, they also might not.
Instagram is not a perfectly sanitised lab, and you cannot control every variable. A particular post that generated record-breaking engagement might not deliver the same results when repeated three or six months down the track.
Remember, succeeding on social media demands authenticity. Timeliness, novelty, and spontaneity play leading roles in content interaction, so do not be afraid to veer from what your analytics tell you.
But when you do try something new, scrutinize the data. The only thing worse than making a mistake is making it twice.
Digital & Social Articles on Business 2 Community
(76)