
So all the preparation is completed and you now have your website live. You have made the effort to put up some good content and you are busy marketing.
Now you need to know what is working and what is wasting your time and money.
There is a famous quote that sums up this predicament – “Half the money I spend on advertising is wasted; the trouble is I don’t know which half.” (This statement has been attributed to John Wanamaker, a US department store merchant).
In reality it is likely that the 80:20 rule applies, in which case about 80% of your success could come from 20% of your marketing activities.
To make the most of your marketing and your website you have to understand where your site visitors are coming from and what they do on your site after they arrive. Without knowing this you are literally flying blind.
Analytics will help you pinpoint the information you need to prioritize your activity.
If you are paying for traffic it is essential to do this kind of tracking to avoid potentially wasting a lot of your money.
You will probably be surprised at what your site visitors are doing, often not what you expect or are trying to influence.
Seeing how many visitors you are getting and where they came from is very instructive, again you might find some surprises here.
There is a picture embedded in all Analytics results. Your visitors are telling you what they want, all you have to do is pay attention and respond.
In this article I am going to show you how to use Google Analytics, it is quite simple to use the basics with a little familiarity.
At first you will need to spend a little time getting used to Analytics, but it is very fast to get what you need when you are set up. I probably only average about 10 or 15 minutes a week getting the data that I am interested in.
The first thing you are going to need is a Google Analytics account. Google has a page here telling you how to do this.
When you have your account set up Google provides you with an ID and also a piece of tracking code. The tracking code needs to be placed on every web page that you wish to track (and I would heartily recommend that you make this all of them).
If you are technically minded this code should placed directly before the </head> tag.
If you are using WordPress there are free plugins available that will put the code on each page for you. Some of these will also put reporting on to your WordPress dashboard for you.
Google Analytics Home Page
The home page looks like this.
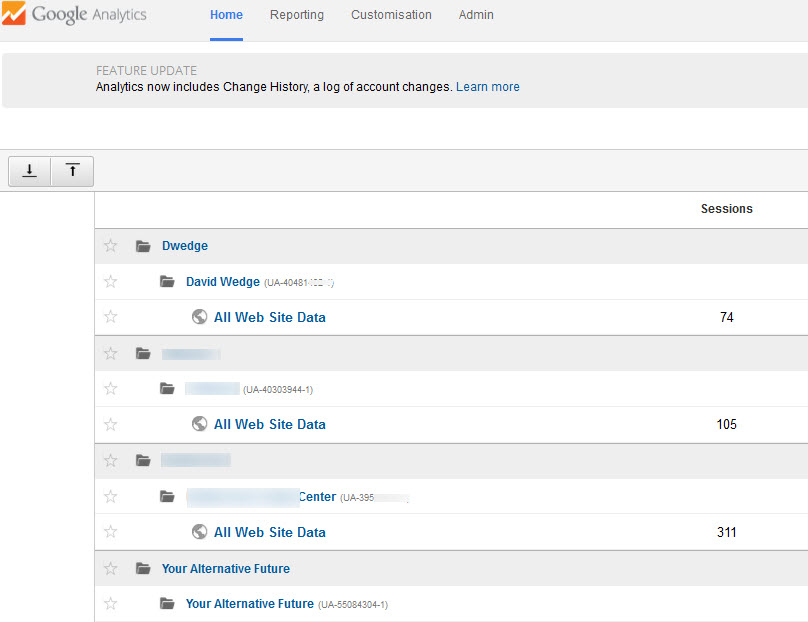
Obviously I have blurred out some details for my own account confidentiality. But you can see that all of my sites are listed together with the Analytics ID for each one. There are some high level stats alongside each site based upon the reporting period that has been selected.
You select the period you want to look at in the top right of the screen. So you can literally choose to look as many days, weeks, or months back as you would like. I tend to go through my reporting about once a week or so.
There is also some useful functionality in the date selection area that allows you to compare to a previous period. So you can have the stats for say last month and the month before running alongside each other.
I have noticed that the reporting for the previous 24 hours is not always up-to-date so I tend to set the reporting period to finish 2 days before the date I am running the reporting on.
The top right of the screen also shows which site is currently selected.
Clicking on ‘All Web Site Data’ for a site takes you in to the reporting functionality.
The Reporting Page
Let me start this section by saying that Google do have a habit of fiddling with menus and terminology. What I am showing you here may appear a little different when you look, but the context and the capability will remain the same.
There is A LOT of functionality available. I don’t use all of it, some of it is too advanced or unnecessary for my needs, you probably wont either but I will try and overview here what you can do if you choose to. Personally I like to keep things as simple as possible, but you can do some pretty clever stuff if it takes your fancy.
Just don’t be put off by the many options Google presents you with. It is nowhere near as daunting as it might first look. You will soon find the functionality that interests you and learn to ignore the rest, but like me you may well find yourself getting more adventurous.
You will have a reporting menu that (currently) looks like this.
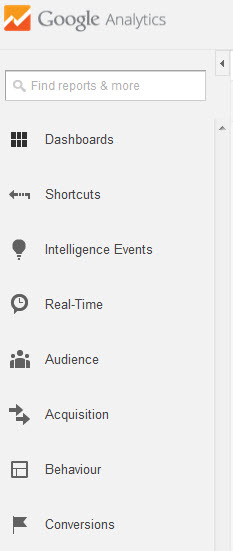
So lets talk about briefly about what each of these menu items are all about. I will drill in to the ones in detail that will be important to you. Most of the important stuff is from Audience down to Conversions.
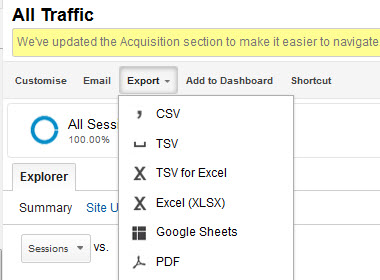
When you get in to the reports you will see that each one also provides a little reporting menu like the one below. So you can you can do things like save the data in different formats, or attach it to an email.
The columns on reports have a little ‘?’ next to them, hovering your cursor over it will give you a short explanation if you are unsure what the column is actually showing you.
I have not explained every item in detail as many are self explanatory and you will learn best by trying things out for yourself.
What I have done is pointed out the functionality that I think you will find most useful.
I will be writing further posts that drill deeper in to specific areas of functionality.
Dashboards
In here you can create customized views of your data by adding selectable ‘widgets’ for the particular data you are interested in. This allows you to also put all the data that is important to you on a single reporting page.
Shortcuts
Here you can save all the reports you commonly use together with their selection criteria, this can save you time and effort and make life a little easier. I have to confess that I never get round to doing this, maybe writing this article will give me a nudge!
Intelligence Events
In here you can set up alerts that will trigger if there are significant variations in traffic or visitor behavior beyond what is defined as normal.
For instance you might post something that generates a large volume of traffic, here you can see where that traffic came from. This could be a popular topic or maybe you just found a valuable new way of getting visitors. Whatever the cause you want to know what it was.
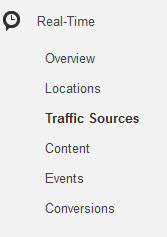
Real-Time
This one is quite simple, here you have the ability to see what is happening on your site whilst you are viewing analytics, it is caturing and displaying data at that very moment.
The full menu looks like this.
Audience
This is the full Audience menu.
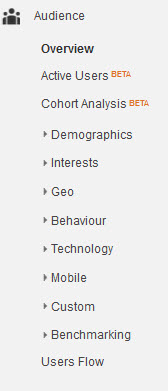
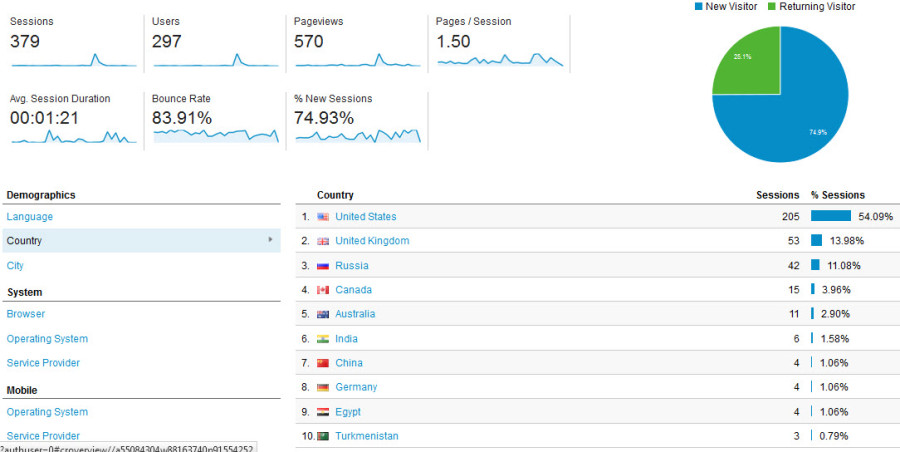
The Overview item provides a lot of data about the visitor as you can see in the following example. You can see how many visitors you had and how long they hung around. For each visitor you can see geographically where they were, and even which browser they were using.
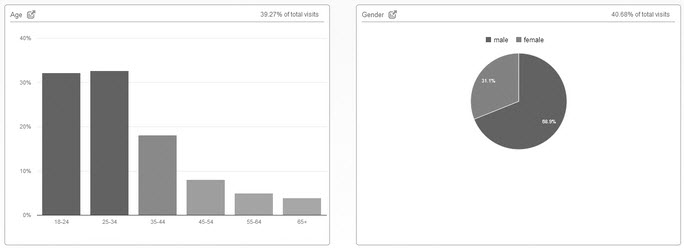
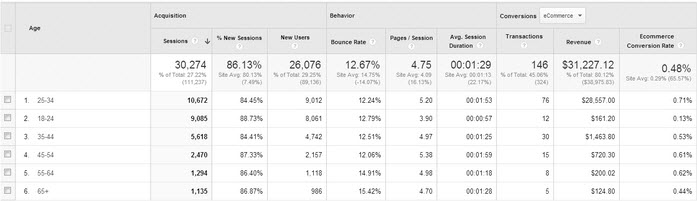
In Demographics as you might expect you can see the gender and age statistics of your visitors. Useful to know if you have been targeting men over 55 and it turns out that more of your audience are actual women aged 35 to 44.
Here are some examples of these screens.
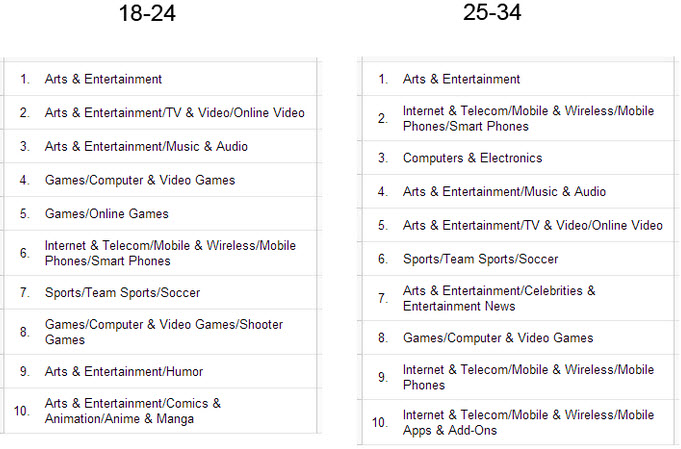
Another intuitive item is Interests which you can drill in to. So if your site covers various topics this will help you understand what is likely to prove the most popular and allow you to target accordingly.
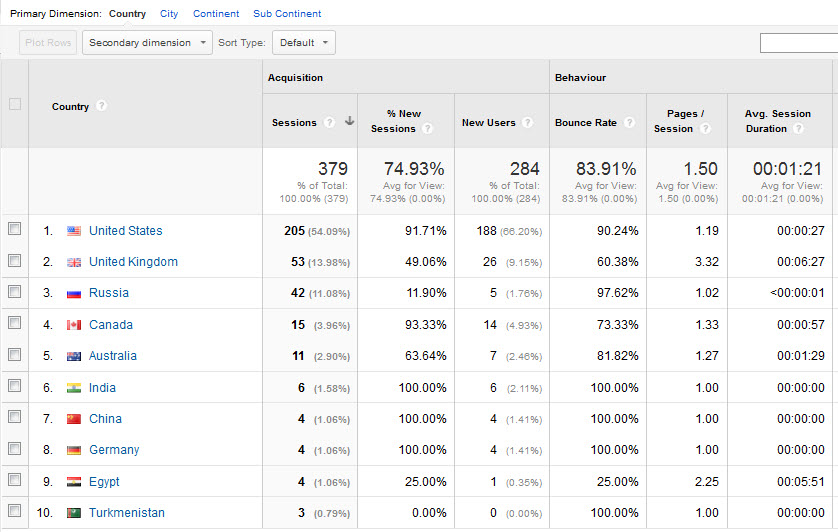
The Geo item allows you to drill in by country. As you can see in this example, this particular site gets most of it’s traffic from the USA and the UK. It does a much better job of meeting the needs of UK visitors than those from the USA, a useful lesson learned.
Clicking on Behaviour within Audience opens up three new views which will show you new vs returning visitors and also Engagement. The Engagement tab is particularly useful as it shows you how long on average visitors are spending on your site pages, if you don’t have their interest you are going to struggle to get subscribers or make sales.
Aquisition
This is where you can see how your visitors found you and where they came from. Clearly a very important area in which you can track how well your various marketing strategies are doing.
The basic menu looks like this.
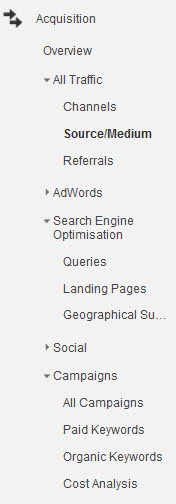
The default setting is to display the top 10 results sorted by the number of visitors each form of traffic generated.In this example I have selected Source/Medium within the All Traffic option.

Lets just talk a little bit about the language and labeling that Google use here.
“Channels” are the different methods by which visitors might find you, eg. a Google search or an email link
“Source” is where the traffic came from, eg. the name of a website
“Medium” describes the method such as an email you sent out
The three columns under the Behaviour heading on this report are particularly instructive.
The “Bounce Rate” for the page shows you the percentage of visitors who arrived on that page and left without going anywhere else on your site. There are exceptions such as Sales pages but generally you should be working on engaging the visitor sufficiently to keep lowering the percentage.
“Pages / Session” tells you the average number of pages viewed during a visit.
“Avg. Session Duration” tells you the average time that a visitor spends on your site.
So in this particular report you can see whether particular sources or mediums are particularly good (or bad!) at bringing you visitors who are enthusiastic to spend time looking around your site.
Behaviour
This is the behavior Menu.

This is where you can find out where your visitors are going to on your site. You can see your most popular pages and posts, and how long on average visitors spent on them. The example below shows the “All Pages” option.

“Entrances” shows you how many visitors arrived on your site at that particular page.
“Conversions”
This requires you to first go in to the Admin function and set up specific goals that you wish to track. A goal could be getting someone to subscribe to your list, or maybe make a purchase.
So in this section you can analyze how much traffic is actually meeting your goals, where it came from, etc.
There is a lot of detail in here. Google Analytics ‘Help’ does a reasonable job of laying this out but it is a bit technical. I will be covering this whole area in a separate post, it is something that is far easier to deal with when you have had experience with the basics I am outlining here.
Reporting Options
Google tries to present all of your reporting information to you without making you scroll. If you look at the bottom right of the screen you will often see that it is only displaying a subset of the available data. An example might be ‘Showing rows 1 to 10 of 26′, in which case you can choose to go the next page all show all the remaining data on the same page.
In the Email option you can set up reports to be sent out automatically to anybody you want at an interval of your choosing, and you can select the format of the report for the attachment. This means you automate everything so that the reports you want arrive in your mailbox when you need them. I prefer to login and drill around a bit, but that is a very personal choice.
All the reports allow you to add what Google refer to as “Secondary Dimensions“. Just above the Headings columns you will see a menu tab that has this option. Selecting this allows you to analyze an addition data item associated with your report.
In the example below I have selected “Country” and can now see if particular pages appeal more to visitors from particular countries. Very useful to know if I am running paid traffic campaigns with the option of selecting or deselecting particular countries.

This amount of reporting flexibility is fantastic, but be aware that reporting on additional dimensions will allow you to select combinations that don’t make much sense, so you need to think about what would actually be useful for you.
Finally
Remember that you don’t have set reports up from scratch every time you need them. Once you have a report you luck just save it to your Dashboard and run it for the date range you need.
(308)