Responsive web design is about creating a page that responds or resizes itself according to the type of device it’s seen on. This might be anything from an oversized desk monitor to a 4 inch smartphone screen. Elements such as images that render nicely on a 17″ monitor might require scrolling on a tablet, which no one likes, or appear cut-off or distorted on a smartphone. More and more people are accessing the web from smaller personal devices. With this ongoing trend, it’s important to have a page with elements that respond differently to different devices. Otherwise, you’re likely to use a growing source of traffic.
Using Google Analytics can show these valuable data and reports about your visitors and how they interact with your page. This is vital information for successful small business website design.
How to Get Google Analytics

All you need to do is go to www.google.com/analytics/ and click the “sign in” link at the top right of the page to be taken to the sign up screen. Once you’ve created an account, you can sign in anytime and be taken to the Analytics page. Visit Tag Manager to find out how to get and add Google Analytics tracking code to your pages.
Custom Reports
Google is already developing reports and algorithms to help you track these smart devices. Go to Audience > Mobile > Overview to view a report showing what percentage of user sessions are coming from mobiles or tablets. Google Analytics also allows users to create custom reports for various responsive design metrics, including detailed drilldown results. This includes Device Category, Operating System Version, and Browser Version so you can see for any set of metrics what device you’re dealing with. Just click on Customization in Analytics and start building a specific report to track visitors from different sources.
Favorite Pages
Go to Site Content > All Pages to see a list of the most popular pages on your site. You might find some surprises about which pages visitors prefer to optimize your content toward different traffic sources.
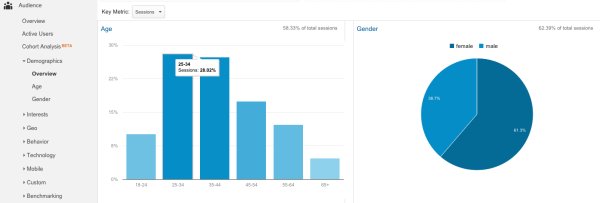
Your Market Audience

The Demographics Overview will give you an idea of who mobile visitors are. Access Age and Gender reports by clicking the links in these charts or the sidebar menu. Compare these demographics to conversion rates to find out what audience you most likely to convert, and you can adjust content and promotions to get the most out of them.
How Visitors Browse
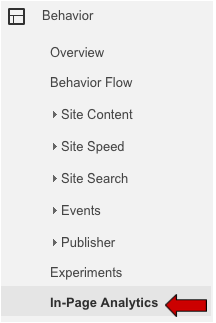
One nice feature of these Google reports is called In-Page Analytics. This can tell you what people are clicking on when they browse your site. Tracking and analyzing this info can help you identify what types or links or categories of information people tend to click on so you can further optimize your site for the most productive links.
All of this works to provide you insight on who is visiting your site, how they are reaching it, how they are using it, and what they like, so that you can go about improving design and content to attract more site traffic.
SEO
Keyword use is one of the fundamental ways search engines use to rank your site, and Google is telling you important information for ranking higher. In the Traffic Sources section you can find the number of visits each keyword has brought in, and add more content for the topics more people are interested in. You can improve your rank by including the best keywords in your text, links, and image tags. Of course, you’ll also get a good idea of what keywords people aren’t using.
Referrals
 You want to put your time and money to the best use, and Google Analytics can help you by showing you what sites and search engines are driving your traffic under the Top Referring Sites data. You’ll be able to tell which links are working for you, which search engines are being used, and whether people are simply typing your domain into the address bar. This can help you evaluate and adjust your marketing campaign to weed out poor or non-performing sources and focus on what people are actually using. You might also find some surprises with links and recommendations you didn’t even know about, which could open whole new avenues for effective marketing.
Improving Content
Establishing which forms and categories of content people use most will help optimize your site to attract more traffic. Are they reading your blog, and on which topics? Are visitors spending more time watching videos or browsing thumbnail images from your galleries? The Top Pages report in the Content Overview portion will show the number of page views, amount of time, number of unique visitors, and more for each page. You might determine what content or features are attracting people to your top page, or top five pages, to create fresh content that draws in more visitors and keeps them coming back. A web designer can optimize your menus and links to focus traffic on your best selling points.
Bounce Rates
This is the percentage of visitors who left your site without viewing more pages. You can find this data in the Traffic reports section. Anything below 50% is normal and acceptable, but discouraged mobile users could drive it up. You want to this number down as low as possible and keep it down, however. If your bounce rates are high, say 80% or more, something about your landing pages – or exit pages – is driving people away. Analytics provides two convenient tabs for this info – labeled Landing Pages and Exit Pages. You need to take the time to examine and optimize the content on these exit pages or you’ll continue losing out on a good segment of potential customers.
Page Load
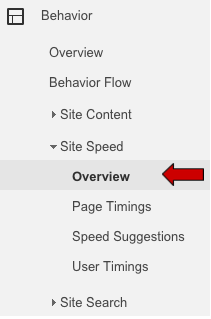
Another tab to pay attention to is the Site Speed tab. Sort these results by average page load time to see which pages are slowest to respond to visitors. People don’t like having to wait for content to appear or links to work. Faster is always better. Review this information regularly to identify your slowest page and figure out what you can do to improve performance. Try opening these pages in different browsers or devices to see if there are compatibility issues. Consider removing features, reducing design complexity, or using smaller or fewer images to improve load time. You and your visitors will be much happier with it. Add Google Analytics for mobile apps to give you an idea of what devices are opening your pages by which means.
All of this data can seem complex and overwhelming, but there are affordable web design specialists already familiar with Analytics. By peeling back the layers and addressing one topic at a time, they’ll be able to narrow down your target audience, where they’re coming from, and what they want in order to get you the best possible results.
Digital & Social Articles on Business 2 Community(99)