
If you’re an ecommerce business owner and want to increase your conversion rates and profits you’re in the right place. In this post you’ll learn how to increase your ecommerce conversions using exit intent polls and a proven process for optimization.
First let’s learn the mindset you need to grow your ecommerce business.
How to increase your ecommerce conversions and sales
In it’s simplest form, ecommerce optimization can be broken down into two steps.
Step 1: Learn where your visitors are leaving your website from
Step 2: Learn why your visitors are leaving and fix it
These two steps represent the two types of data you can collect and analyse to improve your store’s conversion rates.
Step 1 is all about numbers or as it’s more formally known as quantitative data. What do people click on, which pages do they go to and where do they leave your website from. An example source of quantitative data is your Google Analytics account.
Step 2 is all about visitor behaviour, all known as qualitative data. Why do people leave the website from the cart page, why don’t people understand your product descriptions and so on. Examples of qualitative data are user testing, customer interviews, customer surveys and website or exit intent polls.
How exit intent polls fit into a complete process for conversion optimization
Before you learn how to collect qualitative customer data from exit intent polls and turn it into money, you need to understand the complete conversion rate optimization process.
The big-picture optimization process
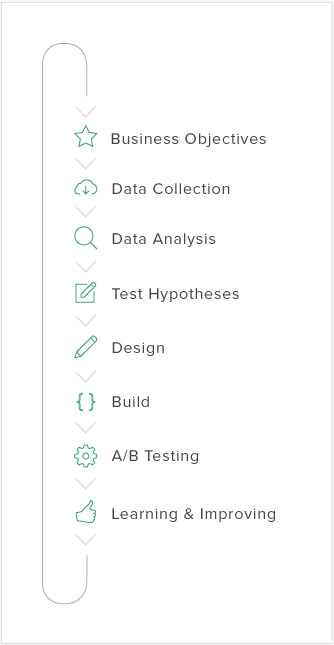
Here is the big picture optimization process.
Step 1: Business Objectives
The first step is business objectives, simply put this means, learn what your business look like now and what your targets are for the next 3 months.
Step 2: Data Collection
The second step is data collection, as you learned this can be quantitative or qualitative data, in your case you’ll be collecting data from exit intent polls.
Step 3: Data Analysis
The third step is data analysis, understanding what the data means.
Step 4: Test Hypothesis
The fourth step is to come up with an idea to test on your website from your data. The ‘hypothesis’ comes from the fact that testing is a science, well it’s actually statistics.
When testing website changes you are trying to prove your testing hypothesis right and make more money.
Step 5 & 6: Design & Build
The fifth step is to design and code the new website changes you are going to test.
Step 7: A/B Testing
The seventh step is to A/B test your new website changes against your current website, this is to make sure the changes increase your conversion rates and make you more profit.
You need to make sure your A/B tests reach statistical significance, so don’t stop your tests early.
Step 8: Iteration
The final step is to review what you learned from your test, did you prove your hypothesis and most importantly, what did you learn about your customers.
Now let’s dig into how to leverage exit intent polls for ecommerce growth.
A guide for increasing ecommerce conversions with exit intent polls
As you remember, ecommerce optimization in it’s simplest form has two steps. The first step is learning where visitors leave your website from…so let’s dive in.
Step 1: Find where visitors are leaving your website from
The simplest way to learn which pages your visitors leave your website from is by looking at your exit pages report in Google Analytics.
To illustrate this technique we are going to look at a case study for ByCharlotte, a jewelry company from Australia my ecommerce agency recently helped.

Log into your Google Analytics account and navigate to: Behaviour > Site Content > Exit Pages

You then need to filter your report to remove pages with low traffic or high exit rates. Click on advanced and follow these filter settings.

Then order your report by the ‘% Exit’ column. The top pages will now be your highest percentage exit pages.
![]()
In this example we’ll look at the cart page.
Step 2: Set up your exit intent polls
Ok, so now you know which pages your visitors are leaving from you need to learn why.
In this example, I use a software called Hotjar. (Other qualitative data softwares include Foresee and Qualaroo). So, the first step is to install your survey software — in this case Hotjar: an all-in-one analytics software that we will be using to create polls on your website.
Once you sign up, install the tracking code into your ecommerce store.

The tracking code below should be placed in the tag of every page you want to track on your site.
If you’re using Shopify this is in the theme.liquid file.
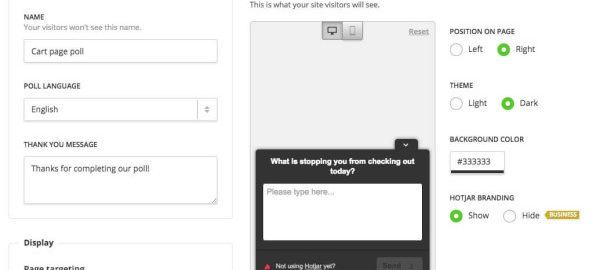
Then you need to create your poll, in our example we are polling visitors to learn why they are leaving the cart page.
Navigate to the Polls menu in Hotjar and click on ‘New Poll’.

Name your Poll and write your thank you message. For our example we are going to ask visitors: “What is stopping you from checking out today?”

This will help us to learn reservations people have to completing their purchase and why they abandon the cart page and leave the website.

You also need to set the page target for the Poll, in our case it is the cart page.

Finally we come to the exit intent technology. When choosing the trigger behaviour, eg. when should the poll be shown, choose ‘When user is about to abandon the page on a desktop device’ also known as exit intent.
What is exit intent technology?
Exit intent basically means that the poll is shown when the user tries to leave the page or moves their mouse towards the browser window cross to close the window.

Finally set the poll to active and start collecting data.
Step 3: Analyse your poll data
There are three ways to analyse your qualitative data, what I call your customer DNA. Keep in mind that when it comes to qualitative data, analysis takes time. The first way is to depict it, this means taking all the answers from your exit intent polls, your customer exact words and turning them into a wordcloud.

In our example above, the exit intent polls answers were focussed on shipping.
The second way is to review all your data and note the major takeaways. What one big pain point or one true goal were people focussed on the most for each interview or survey response. The goal here is to summarize each data point into one or two sentences.
In our study, people left the page because of estimated shipping times, also known as delivery dates. This is often regarded as a top reason for shopping cart abandonment. In our case, the shopping cart did not communicate estimated shipping times or shipping costs— 2 great opportunities for improvement.
The third way is all about quantifying your qualitative data by arranging your data into categories. This allows you to measure how many people were focussed on the same one big pain point or one true goal. In our case 21 of the 32 replies were focussed on shipping.
Step 4: A/B test your ecommerce store changes
So far you’ve learned where visitors are leaving your ecommerce store from and why. In our case study, we learned the cart page had a high exit rate. Through Hotjar’s exit intent poll we learned that people were confused about estimated shipping times and shipping costs.
Here is the original cart design:

And the updated cart design:

Based on this data, we added an estimated delivery date, shipping costs, and a shipping estimate calculator and tested it out against the original experience to measure its impact.
It’s important to A/B test your changes to make sure your new design actually improves the customer experience and your profit. For this I recommend platforms such as Optimizely.
We added the new shipping information at the same time as we revamped the store theme design, so we cannot attribute the 20% conversion lift solely to these changes.
Based on all the data we collected, shipping and shipping time estimates were a recurring problem across all data sources, so we are confident these changes played a large role in the 20% conversion lift we have seen so far since launching the changes.
Kick start your ecommerce growth
As you’ve seen in this post, ecommerce conversion optimization is a two step process. Step one is learning where your visitors leave your website and step two is learning why. The why is where most people start guessing or blindly follow case studies. But as you’ve learnt and now know, the why is all about collecting and analysing qualitative data. This qualitative data holds the key to understanding your customers inside out. It’s about learning their behaviours and emotions, because after all, visitors are humans with real feelings and motivations.
Let me know in the comments what processes you use to learn more about your customer and their needs and wants. Just say, “Hi Giles, I learn about my customer by…” And I’ll get back to everyone of you.
Digital & Social Articles on Business 2 Community(76)