Russ Ketchum, product director of Google Analytics, talks to us about how to create Universal Analytics-like reports in Google Analytics 4.
While many of us miss Universal Analytics (UA), the fact is it’s gone and it isn’t coming back. So, how do we get UA-like findings out of Google Analytics 4 (GA4)? We asked Russell Ketchum, product director of Google Analytics, in the first of a three-part series of conversations with him.
Q: The terminology and concepts in GA4 are different from those in Universal Analytics, what does it mean to recreate UA reports for GA4?
A: Using GA4 requires a new way of thinking. First and foremost, when comparing UA and GA4, it’s important to remember that UA was built when the internet looked very different from how it does today — and operated very differently. To accommodate these changes, we’ve updated features in GA4 to meet today’s expectations.
In UA, everything was a report…and there were a lot of them. And, looking back, there was a tendency to overload the purpose of several reports — which might have been great for power users but could be intimidating for newcomers. With GA4, we’ve taken a more use-case-centric approach.
What we now call “Reports” is intended to be the canonical set of information you’d monitor on a daily basis. It’s customizable in a way that’s shared across your organization so you can be sure that everyone is on the same page and seeing the exact same data (this can be found in the GA4 left navigation).
Q: So how do I come up with customized “reports” about things I want to know?
A: For that you have Explore. Think of this more as a user’s personal “scratch pad.” Explore lets you go really deep in your analysis — it actually has its roots in UA’s 360-only “Advanced Analysis” feature set. It offers a lot of functionality that most of our users haven’t seen before. We don’t expect all users to go there, or at least not every day, but it’s a great option to have. Explore is there to either answer a specific, one-off question — or to inspire a report that your organization would benefit from when added to the Reports section.
And of course, in the Advertising Workspace, we focus on media measurement.
That said, depending on what your goal is, there are almost always more straightforward ways to get the answer out of GA4, rather than aiming to recreate UA reports.
Q: Such as…?
A: I think it is more useful to take this even broader and talk about the challenges users can have with GA4 in general. Let’s be honest, customers were used to Universal Analytics. In a lot of ways, UA taught its users how to think — and GA4 requires you to think differently. We know that’s hard, but it’s also intentional so we’re committed to helping our customers bridge that gulf — for example with the newly launched Analytics Academy.
In UA, you had to shoehorn your view of the world into some pretty limiting constructs — sessions, bounces, last click, etc. …In GA4, we’ve broken free of those constraints, but there’s a learning curve.
GA4 measures user engagement with your site or app differently — and more accurately. It focuses on the users and all the things those users do (measured by different events). Here’s an example:
In UA, you’d typically look at Bounces and Time on Page to get a sense of “not valuable” traffic (or sessions or users or clicks depending on the situation). But that’s not really what it’s measuring. A Bounce is just an “unbound session” — a user came to your site, registered one page view, and took no subsequent navigation action.
Is that a good measure of how engaged the user was? Given how the web worked in 2005 it was. Today, maybe…but more often, maybe not.
What if you have a single-page site? What if your important calls to action on a page don’t trigger navigation?
A: Even if a user was actively scrolling, reading from one article to another, playing all your video content, submitting every lead gen form you wanted them to, out of the box, UA would tell you that they were all bounces and you’d be looking at a wall of manual tagging if you wanted a better answer.
With GA4, we teased it apart and did the hard parts for the customer. Now we have Sessions and Engaged Sessions — and more importantly Engaged Users. Engaged means “active or interacting with” — users that had some interaction with your site not limited to navigation.
There’s a level deeper as well. You could have a user land on a site and immediately leave and a user that lands and just sits there. You can’t distinguish the two in UA even though it’s very different behavior. In GA4 you can. It’s the difference between a Session and an Engaged Session. With modern techniques, we can measure when your site is in focus even if unengaged — so we do.
So that’s really what makes recreating reports from UA hard. In UA you have familiar constructs that may not be answering the questions you think they are. In GA4 you have new terms that mean what they say, but that are different from UA. If you are asking the same questions you did in UA, but GA4 has a better answer to give you, it will.
Q: Are there similarities/overlaps between UA and GA4 I can use to do this?
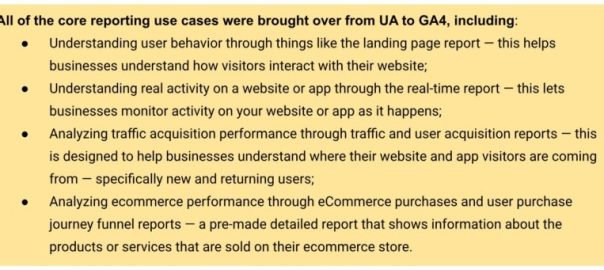
A: Yes, absolutely. GA4 can measure a lot more than UA could and can do it at scale — apps for example. But for the web, technologies may have evolved but we expect our customers to still have the same set of fundamental questions. That’s why we made sure to bring over all of the core reporting use cases from UA to GA4.

GA4 takes many of the existing use cases and features Universal Analytics offered and either adds to them or distills them down to be simpler and more intuitive or customizable.
Q: Are there specific things in GA4 I should focus on to do this?
A: Yes! When you search GA4 for report names from UA, you’ll get pointers to the updated equivalents. Then, when you’re on a given report, but you get a different set of metrics or dimensions than you expected, look to customization — the pencil icon.
Customization is really powerful. Generally speaking, the metrics and dimensions you’re looking for can be added. I’d suggest making a copy of the report before saving it. That way, you can have a version of the report from the old world and a version from the new.
Unlike UA, GA4 can be tailored for your business from the get-go. By specifying your Business Objectives, the UI will be customized for you to show relevant reports and hide others. This is another reason that a UA report you expected may not be there. It may not be as relevant for you in GA4 as it was in UA, in other words, GA4 is likely answering your question in a different way.
If you’re new to GA4, I really recommend taking advantage of the many customization options available. It may not be immediately familiar if you’ve been using Universal Analytics for years, but GA4 was intentionally designed to really get businesses the information that matters in a simple and streamlined way, measuring in a way that more accurately reflects the way people use the internet today.
The post How to create UA reports in GA4 appeared first on MarTech.
(33)