— January 21, 2019
Lately, my life has been all about the stats. Monthly campaign reports have me deep in Google Analytics to the point where ad metrics have made their way into my dreams…or nightmares.
There’s nothing more exhilarating – yes, exhilarating – than seeing a campaign exceed your quantitative expectations. It’s almost equally as exciting to find the reason why numbers aren’t quite what you forecasted. You’re always learning new ways to view, interpret, and report on data so you can improve on the next campaign.
It’s important to note, however, that sometimes the metrics are not exactly what they seem. I’ve come to learn some GA metrics can be a little misleading in the way they’re both presented and/or calculated. For marketers, this could seriously impact reporting insights and any decisions made as a result of those insights. While some metrics are fairly straightforward (ie. Users, New Users, Sessions) others have a little more depth. For reporting accuracy, it’s important to know what the numbers mean and how GA calculates them.
Average Session Duration vs. Average Time on Page
At first glance, the two metrics seem like they measure the same thing. But if that’s the case, why is one duration so much longer than the other?

To put it as simply as possible, the entire misunderstanding between these two metrics is based on the fact that Google doesn’t know how much time a user spent on the last page they viewed. To figure out time spent on a current page, Google uses the time stamp on the following page.
This is particularly evident when users only visit one page and then leave – or in other words, bounce. In this case, both Session Duration and Time on Page are unknown and therefore recorded as 0 seconds. A bounce doesn’t always mean that the user didn’t read your page – in fact, they could have found the exact information they were looking for.
In a scenario where there are no interaction events (more on this later), this can be extremely misleading. A user who bounced could have spent 5 seconds or 15 minutes on the page, and Google would have no way of knowing.
So what’s the difference?
Average Session Duration = Session Duration / Sessions
Average Time on Page = Time on page / (Pageviews – Exits)
Average Time on Page excludes those Exits (and Bounces) whereas Average Session Duration includes all the 0 second sessions. As a result, the higher the bounce rate and the exit rate is, the lower Average Session Duration will be. It’s also important to remember that all bounces are exits but not all exits are bounces.
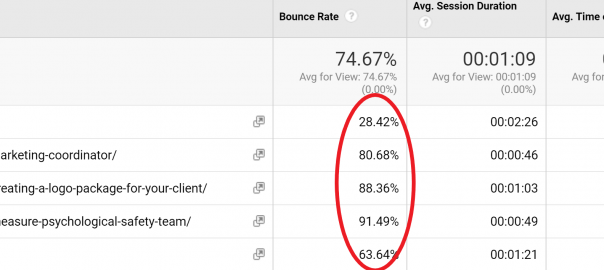
Referring back to our previous example, notice how a lower vs. higher bounce rate affects the two metrics below.

Neither metric is a 100% accurate representation of all the users on your site. Session Duration is skewed lower by a higher bounce rate (ie. if Bounce Rate is 90%, 90% of your sessions will be 0 seconds) and Time on Page is only a sample of your users (ie. if Bounce Rate is 90%, the calculation includes only the times of the 10% who didn’t bounce).
How do I make it better?
Since finding out the difference between the two, we’ve changed our reporting structure to include both metrics. Including both allows us to have a more comprehensive view on how users interact with the page. For example, we now know that if a landing page has a high bounce rate (which they typically do), then the Average Session Duration metric should be taken with a grain of salt. It could also signal the need to improve the accuracy of the metric by adding more interaction events.
Pretty much anything can be set up as an interaction event. Some common examples are clicks, scroll depth, form submissions, downloads, and video plays. These actions are different ways users interact with your page and signal their activity. The more activity you track, the more accurate Google is able to timestamp and determine specific durations.
At the end of the day, individual metrics should always be taken in the context of other analytics. Each measurement is just one piece of a larger puzzle – your campaign. It’s important to understand what each metric means and how it impacts the rest of your dashboard as a whole. Approaching Google Analytics with a holistic campaign view will allow you to paint a more comprehensive picture in your reporting.
Digital & Social Articles on Business 2 Community
(33)