
Do you have Google Analytics installed on your site, but don’t understand its reports? Do your attempts to read the numbers leave you confused and confounded? Do you lack the umpteen hours needed to study in the Google Academy, but need to read your Analytics now?
Well, read on, user. I’ve got a bunch of fun ways to view your Google Analytics you can implement now.
Google Analytics is such a powerful tool that it can provide almost too much information for average WordPress users to comprehend. Instead of floundering around amid the pages of charts and timelines, it’s smart to sort what you need to know into views you can chew on.
If you don’t have Google Analytics installed, read this post about how to get it there. Once installed it will take a day or so to see the numbers on your Google Analytics dashboard.
View your Google Analytics
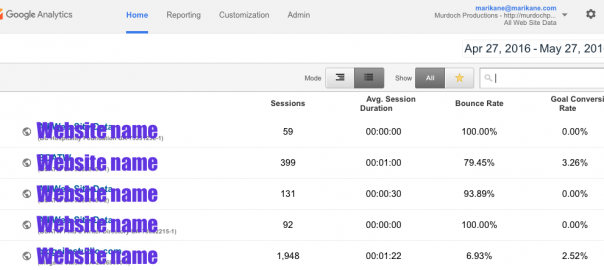
When you first open your Google Analytics Home page, you’ll see all the web properties you own.

Google Analytics home page
By default you get the indented view by which clicking on one property opens it to a basic view of Sessions, Average Session Duration, Bounce Rate, and Goal Conversion Rate.
What’s a Bounce Rate? For all sessions that start with the page, Bounce Rate is the percentage that were the only one of the session. In other words, the amount of pages where one was read before the user left the site. Over 50% Bounce Rate is not good.
Goal Conversion Rate is the percentage of pages where the user completed a goal. For that to show, you need to create goals, which I’ll explain soon.
Clicking on the list Mode button shows all those metrics for all your properties for the dates shown in the upper right corner.
See, you’re already reading Google Analytics!
Now, we’ll drill down.
Audience overview
Click on your property in the list view and you’ll be taken to Audience Overview.

Based on the date range set you’ll see a big chart with peaks and valleys as well as smaller charts describing Sessions, Users, Pageviews, Pages per Session, Average Session Duration, Bounce Rate and Percentage of New Sessions.
Plus there’s a pie chart showing New Visitors and Returning Visitors.
Below all that is a bar chart where you can see Demographics, System, and Mobile breakdowns.
All good information, but not always what you need to see every time.
Google Analytics is so deep and exhaustive in it’s output that clicking around in it’s dozens of pages can lead to information overload.
What you need to do in order to have Fun Reading Your Google Analytics is to arrange the metrics in a way that’s easy for you to view.
But first, a word about the A, B, C’s of Google Analytics…

The A, B, C’s of Google Analytics
In the sidebar to the left you’ll see a menu. There’s Dashboard, Shortcuts, Intelligence Events and Real Time, which I’ll get to soon.
Below that is Audience, Acquisition, Behavior and Conversions, each with an Overview plus subcategories.
Audience is just that. It describes your readers.
Acquisition is your traffic and how your audience made their way to your site.
Behavior is what your audience did on your site.
Conversions is what they committed to while visiting, what goals they completed.
So when you clicking around in analytics and wonder why you’re seeing numbers a certain way, look at the sidebar to check which A, B, C area you’re in.
Metric vs metric
 On all of these pages you can select different metrics to compare against each other. On the left above the chart, click Select a Metric to get a dropdown menu and select a metric.
Your chart will then show two lines; a dark one for the first metric and a lighter blue line representing the second metric. For instance, see all sessions and how many are new users.
Other views you can play with include Dimensions which include Default Channel Grouping, Source/Medium, Source, Medium, and Other. Two different dimensions can be compared as Primary against Secondary.
By clicking the views next to Advanced on the left above the chart you can choose to see the data in a chart, pie chart, bar graphs, keywords and pivot.
Now we’re having fun!
Customize your dashboard
Ok, now that you’ve checked out different views of various types of data, you need to decide what views you want to see on a regular basis. Once you decide, it’s time to create a customized dashboard.
Go to the top of the sidebar menu, click Dashboard>Private>My Dashboard. Or you can click New Dashboard, choose a blank or Starter Dashboard, then name it.
I would go for the Starter Dashboard, just to save time.
The Dashboard allows for a maximum of twelve widgets. The widgets on the Starter Dashboard can be deleted by clicking the X in the top right of each one.
Each widget can be edited by clicking on the pencil.
You can add widgets by clicking +Add Widget at the top left. That brings up a window full of options you might or might not relate to.
If you are a visual person like me, I suggest adding widgets from the pages. Just navigate to the A, B or C view you want to see and at the top left of that page, click Add to Dashboard. That view will then be added to your custom dashboard exactly as you’ve set it.
And just like with WordPress Widgets, not only can you drag and drop the widgets around your new dashboard, you can also choose the number of columns to arrange them in by clicking Customize Dashboard.
Your finished dashboard is what you’ll see when you enter the Analytics site.
Select shortcuts
If you want to view the same Analytics pages in all their full glory, you can create a list of Shortcuts to them.
Shortcuts appear in the sidebar menu just below Dashboards. And they are as easy to create.
Just go to the page view you want and right next to Add to Dashboard you’ll see Shortcuts. Click on it and a window will pop up asking for a name. That name appears in the sidebar under Shortcuts.
Now you can just click through Shortcuts to view all your favorite analytic pages.
Create goals
In order to see activity appear on the Conversions pages, you have to create goals. You need to tell Analytics what you expect in order for it to tell you what happened.
Analytics is great for reporting but it’s a terrible mind reader.
To create a Goal, click on Admin in the main menu and find it in the View column. Click on New Goal. Start by naming the goal.
There are four types of Goals
- Destination – where a specific web page loads, ie: Thank you for registering
- Duration – is a measurement of time on screen, ie: 10 minutes or longer spent on a site
- Pages/Screens per session – where a user views a specific number of pages or screens, ie: 5 pages have been loaded
- Event – where an action defined as an Event is triggered, ie: contact form submitted
(It also includes Smart Goals, which is for AdWords, something I’m not touching in this post.)
Once you choose a Goal Detail and hit continue, more fields will appear to clearly define each goal.
If you choose Destination you only need to enter the permalink for the page, not the entire URL.
And in Destination you can add a Value as well as a Funnel. So, put your funnel hat on and start adding pages you expect users to navigate through to get to the goal.
Remember to add widgets like Goal Completions and Revenue to your Dashboard or Shortcuts.
Intelligence events
Here’s a fun thing to do if you want to put yourself on edge about your web site.
Create some Intelligence Events to warn you when something’s going wrong. Or, right.
To create an Intelligence Alert go again to Admin and then to Custom Alerts under View. Hit + New Alert. Name the Alert, apply it to the sites you want to monitor, the Period of time to monitor, ask it to email or text you with the alert and then set the conditions for which you want to be alerted.
The emails won’t tell you anything more than the conditions were met, so troubleshooting any anomaly is entirely up to you.
You can see your Alerts in the sidebar under Intelligence Events.
Have fun getting scared!
Learn more
These are just a few fun ways to view your Google Analytics, but being as deep as the ocean, there are lots more things to do in Analyticsland. You can learn more at the Google Analytics Academy for free if you have the time.
What are your favorite ways to view Google Analytics?
Digital & Social Articles on Business 2 Community(53)