LinkedIn has proven itself as a great lead generation tool for businesses across the board. But, unlike most other social media platforms, you can’t just look at basic metrics in order to understand if your strategy is actually pulling its weight.
For the full picture of your successes and shortcomings, you’ll need to turn to your LinkedIn Page Analytics.
Getting to Know LinkedIn Analytics
The LinkedIn Page Analytics tool gives you an in-depth look at the performance of your LinkedIn page.
Available to page admins, you can:
- Evaluate the effectiveness of your updates.
- Better understand the demographics of your followers and visitors and where they come from.
- Measure the success of your Pipeline Builder campaign.
- Measure the effectiveness of your talent search.
All of this data is easily accessible through your LinkedIn Page admin center or, for even better functionality, via an admin widget and analytics module.
The 16 Best LinkedIn Metrics for Marketers
Half the battle in marketing is deciding what your goals are. What sort of results are going to meet your company’s needs? What data will be the most relevant to you and how can you analyze it?
LinkedIn does a pretty good job breaking down the more important metrics for you. Let’s dive in:
Traffic Metrics
You can monitor any and all page views from anywhere on your profile on the Traffic dashboard. Daily numbers will appear on a line graph, defaulted to the last two weeks of aggregated page traffic data.
1. Page Views
Pretty self-explanatory, right?
These are the number of visits your profile or company page has received within a specified time frame. This will give you a pretty good idea of how well you’re doing at pulling traffic in.
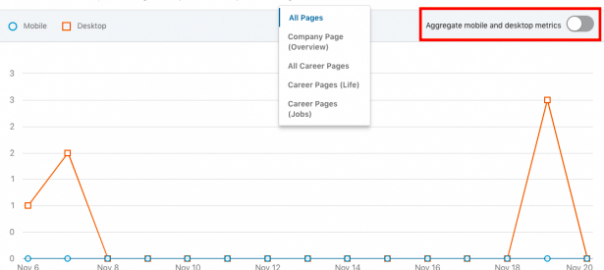
2. Desktop Visits
The traffic metrics graph can be split by device. To see a count of visits via desktop, look for the orange line.

Source: Hootsuite
3. Mobile Visits
On the same graph, locate the blue line for mobile visits.
Keying into where your traffic is coming from will inform you on audience behavior. Is your audience finding you through their mobile devices or at their desk? Which strategies can you optimize to better serve their preference?
4. Time Range
This is a filter that allows you to isolate data to a specific time or date.
5. Page Filter
If you want analytics for a specific page to monitor its performance, you can find more specific data with this filter. This is a great tool when optimizing your profile, as you’ll be able to identify gaps or underperforming pages.
Visitor Metrics
These are demographics that will help you better understand who is viewing your pages. Each one can provide valuable information to your marketing and sales teams as they learn more about the audiences you attract.
6. Job Function
This is the visitor’s professional niche.
7. Location
You can see the city and country that visitors reside in. Are you pulling in business on a local scale or internationally?
8. Rank
Knowing a visitor’s seniority within their own company can also inform you whether decision makers have taken note of your brand or not.
9. Industry
Naturally, your business will have a specific target industry or market, so this data is pretty important.
10. Company Size
Depending on what your business offers, or even the size of your own company, you may be targeting a specific company size. Make sure you’re attracting the right attention.
Follower Metrics
Some businesses determine success by getting people to follow their company page. You’ll want to monitor a few things to make sure you’re growing consistently.
11. Gains
You can track your follower growth in two different ways: organic and paid.
This will give you a pretty clear understanding of which strategies are working best for you with a positive ROI.
12. Demographics
Similar to your visitor data, you can learn more about who’s invested in your page and start tailoring your content to meet their demographics.
Engagement Metrics
LinkedIn users can engage with your updates and pages in a wide variety of ways, both by paid and organic means. Here are some of the more important metrics you’ll want to monitor.
13. Likes
Naturally, this is what everyone goes crazy for on any social media platform, even one as professionally focused as LinkedIn.
14. Clicks
How often does someone actually click on your content out of interest, rather than scroll past it in their feed?
15. Impressions
This is how many times people saw your content. You can analyze this data by including revisits or without (referred to as unique impressions).
16. Shares
Probably one of the more important engagement metrics out there, take a peek at who’s sharing your content and what updates they’re deeming share-worthy.
How LinkedIn Analytics Influence Strategy
Of course, all of this data has to mean something at the end of the day. What use is all of these graphs and numbers if you can’t turn it into action for your business?
These analytics can actually help you shape up your content strategy on LinkedIn to either attract new leads or bring in talent if you’re hiring. With a better understanding of your audience and what they perceive as valuable, you can redirect your resources into more profitable strategies that will yield great results.
It’s actually rather easy to manage your LinkedIn pages and monitor their progress.
Like any other marketing strategy, your pages can be optimized to bring in bigger and better leads. Start determining what changes need to be made in order to do so by assessing your LinkedIn analytics.
Digital & Social Articles on Business 2 Community
(54)