We live in an age of information overload. We’ve learned to skim an article or blog post for key points, and if we find it confusing, complex, or too long, we bounce away from the website. People risk losing their site visitors even if the quality and the value of their work is high.
In order to remain competitive, there’s a need to adapt to changes in the digital environment and to shifts in audience behavior. Many businesses have decreased their offline advertising spending in lieu of drafting long-term online marketing plans and SEO campaigns.
Allow me to introduce to you one way to achieve this online visibility increase that incorporates a smart SEO-aware approach – An Infographic Creation and Distribution Campaign.
Why Use Visuals?
What you can do with text alone is limited. By using visuals like infographics , you have a better chance of capturing and keeping your audience’s attention, conveying more information in less time, and spreading your message faster.
According to research summarized by Wyzant in a convenient infographic (of course!), humans now lag behind the goldfish in terms of being able to concentrate or focus on a task. Infographics combat this by balancing text with visuals because visuals take less time and mental energy to process (at a rate of almost 60,000 times faster).
We’re also remarkably forgetful. We lose all sorts of things, from our keys to the URL of that product we thought about buying (or that hilarious cat video we couldn’t watch at work). Infographics combat this by being “sticky”: adding relevant images to information leads to a significant increase in retention.
Visual materials like infographics increase audience engagement because readers pay attention to information-carrying images. “When the images are relevant, readers spend more time looking at the images than they do reading text on the page.”
The Power of Infographics
Changing the typography of your site could improve the readability of your post, but only to a certain extent. Sometimes, you need a better strategy to boost the reader retention ratio of your website – you need the power of the infographics:
- Infographics instantly grab the readers’ attention – A clean design can do miracles. Aim for a well-matched color palette, a tastefully selected font family, custom graphics and images, a clear understanding of whitespace, and the proper ratio of visuals to text, and you could greatly influence the magnetism of your story.
- Infographics are perfect for less-than-exciting industries – Commonplace ideas could be welcomed more warmly by your readers if they’re translated into a nontraditional, more visual medium. Think outside the box and you won’t regret it.
- Use infographics to explain hard-to-grasp concepts. When words fall short in educating, images can help you “draw the whole picture” much more effectively.
- Infographics often appeal to one’s emotions and it is a wide-spread notion that the key technique of the Art of Persuasion is triggering a strong emotion in the audience.
- Infographics have a better chance at going viral. The high readability and the visual attractiveness of infographics make them accessible to a larger pool of people and more likely to be shared. In fact, according to Visually, “tweets with images [like infographics] receive 18% more clicks, 89% more favorites and 150% more retweets.”
- Infographics have a longer life span. They are sharable assets that can reflect a concept, event, or idea, which is different than announcing a piece of news. A good infographic could be reshared for years after its creation.
- Infographics help you reach a broader audience. Creating content solely for your target audience can sometimes limit your online visibility. Attracting people who are not interested in your product/service would hardly boost your sales, but it could improve your online visibility and indirectly help you reach your targeted customers.
How are Infographics related to SEO
SEO (Search Engine Optimization) has grown to encompass so much more than on-site tweaks and generic inbound links. Things like bounce rate, time of engagement, and the quality of your backlinks are now things that also have to be considered.
The key parts of every SEO campaign are:
- On-site tuning and optimizing
- Creating unique, high-quality content
- Earning relevant backlinks from industry websites
- Generating a strong social media presence
If we look at SEO from a larger “online marketing” perspective, we see that a successful SEO campaign achieves some or all of the following positive results:
- Increased website traffic
- Increased number of relevant referral links
- Increased social media engagement with company content
- Increased lead generation and conversions
- Increased brand awareness
- Increased authority and reputation
So what does all of this have to do with Infographics?
A masterfully-crafted infographic affects three of the four major stepping stones of an SEO campaign:
* CONTENT: Infographics add unique and valuable content to your website. They can educate, entertain, raise awareness around an important issue, and engage your readers.
* SOCIAL SIGNALS: The better the infographic you’ve created, the more likely it is to be shared on social media.
* BACKLINKS: Once the chatter about your infographic begins, there a higher likelihood that bloggers, journalists, and regular online users might like to discuss it further. They might decide to feature it on their own sites or share their opinion of the infographic and the topic it addresses.
With an infographic, you get all 3 at the price of 1. You might be able to achieve your SEO campaign goals and see greater website traffic; increased company authority and brand awareness; more leads, and more website conversions.
You won’t necessary observe an increase in conversions in terms of sales, but you will attract attention. This is the first step towards converting your website visitors into returning customers.
The Key to a Successful Infographic Campaign
”Your message is only as good as your ability to share it!” ~ Column Five
Imagine investing days into researching the right topic, selecting the best sources of information, planning on how to unravel your story in an innovative and engaging way, figuring out what to keep and what to omit, coming up with the optimum color palette, getting custom image creation, then revising, editing, recreating, and editing once again. You’ve drafted a high-quality infographic. It’s a ton of work, and it would be shame to let it all go to waste.
The second most important step in every infographic campaign (behind the design and creation) is distribution.
When you get to the distribution phase, it might feel like you’re really close to the finishing line. You may have a great idea. Maybe you hired a skillful designer who helped you create and style the perfect mix of information that both entertains and educates while appealing to both the readers’ mind and heart.
But if you don’t know how to get your infographic in front of people interested in the topic, you will see no traffic increase, no new leads, and no social virality.
How to Organize the Distribution Process
While the infographic distribution phase deserves a post of its own, there are some simple strategies that you can adopt when publishing and distributing your infographic.
Here are the essential things to remember:
- Find the websites where your targeted customers tend to hang out, chat, read, comment and approach the editors of those sites
- Find industry blogs and spread your outreach to a broader pool of similar industry blogs that are indirectly related to your business and the topic you tackle in your infographic.
- For example: If you are a restaurant owner who created an infographic about pasta cooking techniques, you should might want to contact cooking blogs or other websites with a strong food focus. You could also spread the word to mom bloggers, and work your way out to blogs that deal with Italian culture and traditions or traveling blogs that have a section on testing different cuisines, etc.**
- Find news sites that have discussed similar topics
- Take advantage of the low-hanging fruit: distribute your infographic to infographic sites (look for sites with high editorial standards; sites that have strict selection criteria when it comes to the quality and value of the infographics they share (like Infographic Journal).
- Identify the industry influencers and show your infographic to them
- Be creative!
Examples of Successful Infographic Campaigns
The success of an infographic campaign should be measured against the initials goals set prior to its publishing date. Even if a “success” is a subjective term, an infographic that inspires a great deal of comments and social activity or one that gets republished on respected and popular websites could be considered part of a campaign marked by success.
The following infographics are great examples of infographics that were part of successful infographic campaigns:
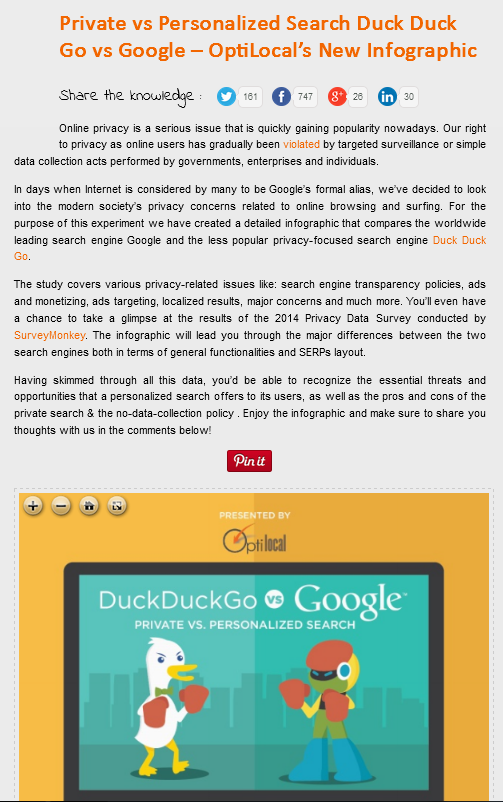
Our first example is from OptiLocal. Their custom infographic titled Private vs Personalized Search addresses the sensitive issue of online privacy. They decided to compare Google (the world’s leading search engine that offers personalized results to its users) and DuckDuckGo (its less popular and privacy-oriented competitor).
This infographic triggered high response in the social networks, which was a result of natural sharing, word of mouth, and personal outreach to industry influencers. There was no monetary investment in terms of paid ads, and no promoted or sponsored posts were dedicated to the infographic distribution campaign.
The Why Your Brain Craves Infographics visual by Neomam is an interactive infographic about infographics. The success of this visual has impressed even its creators – it has earned the company hundreds of referral links from unique domains throughout the past few years (it was first posted in 2013), and it remains a powerful source of new inbound links.
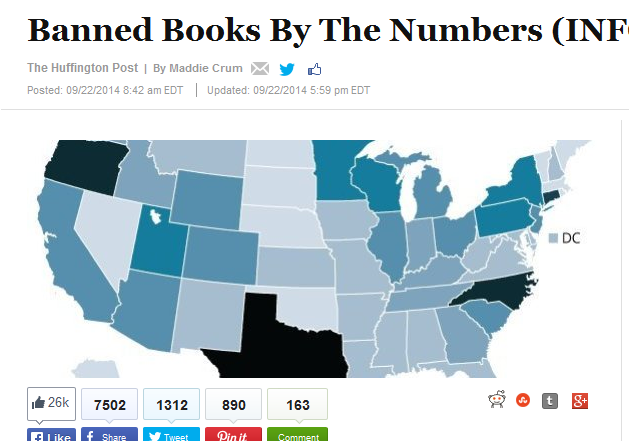
This last example of a successful infographic campaign, The Most Frequently Challenged Titles Since 2013, was created by the Huffington Post. The visual lists books and authors that have been banned or censored throughout the US. This is a controversial topic, and this infographic generated a wave of 163 comments along with massive viral activity on social – a sure sign of a successful piece of content!
There is no perfect formula when it comes to creating a successful SEO campaign with infographics. Creating an infographic is a creative process, and so is its promotion. Start by being familiar with your target customers, understand their needs and problems, offer them a solution with a bit of entertainment, and make sure they see your message. Then, let the content do the work!
Digital & Social Articles on Business 2 Community(81)